

PALU Price Predictions: Short-Term Trading vs Long-Term Holding

Introduction to PALU Price Analysis
The current market position of PALU demonstrates significant growth potential, as evidenced by its rapid appreciation since its initial listing on MEXC in October 2025. PALU is currently trading between $0.061 and $0.1249, with a real-time PALU price of $0.100699. This price action reflects remarkable resilience despite market volatility, with a 24-hour change of +25.85% and a 30-day surge of +2,417.47%. PALU's market cap is approximately $99.89M, ranking it among the top emerging meme tokens on the BNB Chain.
Understanding both short-term and long-term PALU price movements is crucial for investors aiming to maximize returns in the PALU ecosystem. Key factors influencing PALU price predictions include:
- Development progress on the platform's core products
- Growing user adoption metrics (over 18,000 holders)
- Token unlock schedules and supply management
- Broader market sentiment toward meme and BNB Chain tokens
With a total supply of 1 billion tokens and the entire supply reportedly circulating, PALU's distribution strategy creates a dynamic environment for both short- and long-term PALU price analysis. The token's listing in the MEXC Meme+ Trading Zone and subsequent migration to the Innovation Zone further highlight its evolving market status.
Short-Term Price Prediction Methods and Strategies
Technical analysis tools are essential for PALU short-term price forecasting. Traders frequently monitor:
- Moving Average Convergence Divergence (MACD)
- Relative Strength Index (RSI)
- Bollinger Bands
These indicators help identify potential entry and exit points for PALU trading. For example, the formation of higher lows on the daily chart suggests strengthening bullish sentiment, with key PALU support levels established at $0.061 and $0.1204.
Market sentiment and social indicators play a critical role in PALU's short-term price movements, especially given its meme token status and viral mascot appeal. Social engagement metrics tracked by analytics platforms show increased PALU mentions across major crypto communities, with sentiment analysis indicating predominantly positive discussions.
Short-term PALU trading approaches include:
- Swing trading strategies to capture gains from PALU's characteristic multi-day price cycles
- Day trading focused on volume spikes, which often precede significant PALU price movements, particularly following platform updates or new partnership announcements
- Sentiment analysis tools to predict PALU price movements based on community engagement
Successful traders combine technical analysis with fundamental developments to identify high-probability PALU trading opportunities.
Long-Term Price Prediction Approaches
Fundamental analysis for PALU valuation centers on:
- User growth metrics
- Platform adoption rate
- Revenue generation potential from its meme and community-driven ecosystem
Analysts examining PALU's long-term potential focus on the expanding market for meme tokens and viral crypto assets, which is expected to grow as the broader cryptocurrency market matures. The project's community engagement model shows promise for creating sustainable economic value beyond speculative interest.
On-chain metrics provide critical insights into PALU's network growth, with:
- Increasing active addresses
- Growing transaction volumes
- Rising staking participation (where available on MEXC)
The distribution pattern of PALU tokens shows a trend toward broader market participation, suggesting potential for reduced volatility over time.
PALU's development roadmap includes major milestones such as:
- Expansion of community-driven features
- Integration with meme and viral marketing platforms
- Launch of additional engagement tools within the PALU ecosystem
As the platform progresses, analysts expect substantial growth in utility-driven token demand, potentially driving PALU price appreciation independent of general market trends.
Factors Affecting PALU Value Across Time Horizons
Several factors impact PALU's value over different time horizons:
- Regulatory developments: As global economies and emerging markets develop regulatory frameworks for meme and BNB Chain tokens, PALU's proactive compliance approach positions it favorably.
- Macroeconomic influences: Interest rate policies, inflation trends, and technology sector performance all affect PALU's market dynamics. During periods of economic uncertainty, PALU's appeal as a community-driven asset may increase.
- Competitor analysis: PALU faces competition from traditional meme tokens, centralized viral marketing platforms, and emerging Web3 meme protocols. Its unique combination of viral appeal and tokenized incentive mechanisms creates significant barriers to entry for competitors.
- Network effects and ecosystem growth: Strategic partnerships with key crypto media platforms and influencers strengthen PALU's competitive position in the evolving meme token market segment.
Conclusion
When approaching PALU investments, the most effective strategies combine short-term PALU technical analysis with long-term fundamental evaluation. Understanding both timeframes allows investors to make more informed decisions regarding PALU regardless of market conditions. For a complete walkthrough on how to apply these PALU prediction methods and develop your own successful trading strategy, check out our comprehensive 'PALU Trading Complete Guide: From Getting Started to Hands-On Trading'—your essential resource for mastering PALU learning in any market environment.
The articles shared on this page are sourced from public platforms and are provided for reference only. They do not represent the position or views of MEXC. All rights belong to MEXC. If you believe any content infringes upon the rights of a third party, please contact service@support.mexc.com for prompt removal. MEXC does not guarantee the accuracy, completeness, or timeliness of any content and is not responsible for any actions taken based on the information provided. The content does not constitute financial, legal, or other professional advice, nor should it be interpreted as a recommendation or endorsement by MEXC. For expert insights and in-depth analysis, visit MEXC Learn.
Learn More About NEAR
View More
Rate Hike Lands, BTC Hits 8-Month High — Bad News Priced In or a Short-Squeeze Rally? | MEXC Alpha Trader Weekly Research

MEXC On-Chain Daily Report: SoFi Uses Stablecoin Settlement for Mastercard Transactions, Annualized Volume Expected to Exceed $25 Billion

Nvidia Stock Price Prediction: Is the AI Boom Now Eating Nvidia's Own Profit?
Latest Updates on NEAR
View More
SpaceX Options Surge: Turning IPO Momentum Into a Volatility Test
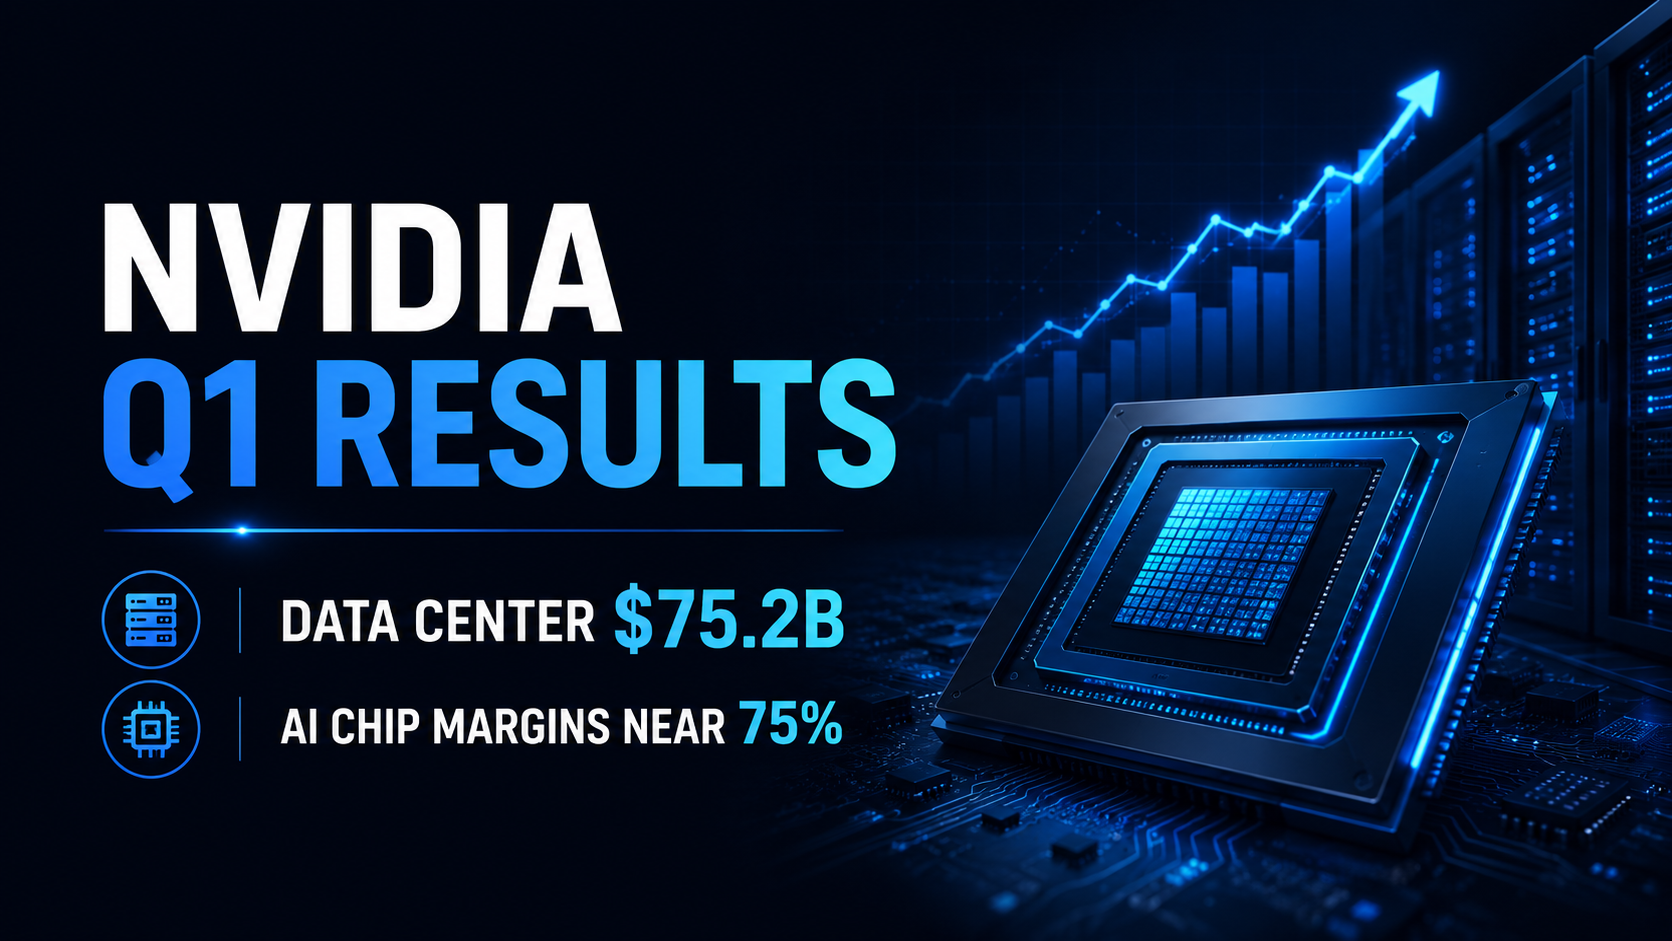
Nvidia FY2027 Q1 Earnings Review: Data Center Revenue Hits $75.2B as AI Chip Margins Hold Near 75%

Miden USDCx Brings Private Stablecoin Payments Onchain


You May Also Like
HOT
Currently trending cryptocurrencies that are gaining significant market attention
Crypto Prices
The cryptocurrencies with the highest trading volume
Newly Added
Recently listed cryptocurrencies that are available for trading