Introduction
Tesla ended the week at $354.72 after a 2.13% decline on Friday, October 16, the day after its Roadster demonstration. The stock gapped higher at the open, then sold off by more than 5% to a low of $349.33, producing the widest trading range of the past 50 sessions. That move extended a five-session losing streak, left the shares 7.31% lower for the week and parked the close just $1.88 above the $352.84 closing floor that has held for 34 sessions. With third-quarter earnings due on Wednesday, October 21, after the close, price and volatility are both pressing into the same area at once. This article walks through what Tesla announced, why the stock reversed, what the chart shows and how bulls and bears are reading the setup.
Executive Summary
Tesla closed Friday at $354.72, down 2.13% on the day and 7.31% for the week, after finishing October 9 at $382.70, the highest close of the past 50 sessions.
Friday's trading range was $21.17, from $370.50 to $349.33, or about 6% of the closing price, the widest of the 50-session window against an average near 3.1%.
Volume reached about 62.1 million shares, roughly 72% above the 36.2 million average of the previous 30 sessions and the third-heaviest of the period.
All 34 closes since August 31 have landed between $352.84 and $382.70, and Friday finished $1.88 above the lower edge.
Third-quarter deliveries of 486,532 beat the company-compiled consensus of 461,974 by 24,558, while falling about 2.1% below the same quarter a year earlier.
Results are due Wednesday, October 21, after the US market close, with a webcast at 5:30 p.m. Eastern time.
What Tesla Actually Announced
Tesla's most concrete announcement came on October 2, when it reported third-quarter production of 464,391 vehicles and deliveries of 486,532, with 13.7 GWh of energy storage deployed. Model 3 and Model Y accounted for 478,237 of the deliveries, and all other models for 8,295. Deliveries exceeded the 461,974 vehicles in the company-compiled consensus by 24,558, a beat of about 5%, though they were roughly 2.1% below the 497,099 delivered in the third quarter of 2025. Deliveries also ran 22,141 vehicles ahead of production. The company noted that delivery and deployment figures are only two measures of its financial performance and are not an indicator of quarterly financial results.
The release also set the calendar. Tesla will post third-quarter results after the market closes on Wednesday, October 21, and will issue a brief advisory linking to the Q3 2026 update on its investor relations site. Management will hold a live question and answer webcast at 4:30 p.m. Central time, which is 5:30 p.m. Eastern time.
The second announcement was a product demonstration. On the evening of Thursday, October 15, Elon Musk unveiled the next-generation Roadster in a livestream from a SpaceX test facility in Texas. The car launched up a ramp, flipped in midair and landed on its wheels. Musk said production would begin in 2028, and no price was announced. Tesla's own website describes the flying configuration as an invitation-only option that is not approved for public road use.
Why the Stock Reversed
The stock's path over the past two weeks helps explain Friday's reversal. Tesla jumped 4.65% on October 2 to $370.59 on about 55.3 million shares after the delivery report, added 2.20% on October 5 to $378.73 and reached $382.70 on October 9 with a 2.05% gain. That was the highest close of the 50-session window.
Then the declines began. Tesla fell 1.22% on October 12 to $378.03, 0.74% on October 13 to $375.23, 2.15% on October 14 to $367.16, 1.29% on October 15 to $362.44 and 2.13% on October 16 to $354.72, a five-session losing streak that took $27.98 per share off the stock.
Friday's session had its own shape. Tesla opened at $369.15, 1.85% above Thursday's close, as investors reacted to the Roadster livestream. It then sold off $19.82, or about 5.4%, to a low of $349.33 and finished at $354.72, 3.9% below the open. About 62.1 million shares traded.
The broader market offered no cushion. The Nasdaq Composite fell 2.1% on Friday to 26,140.03 and lost 4.5% for the week, its worst week since June, as chip companies pulled back on worries about how long the AI buildout can last. Micron (NASDAQ:MU) fell 5.6% and Intel (NASDAQ:INTC) fell 5.8% that day. Tesla's weekly loss of 7.31% exceeded the Nasdaq's by a wide margin.
The Technical Picture
The chart story is a closing range that has held for more than a month. Every one of Tesla's 34 closes since August 31 has landed between $352.84, set on September 29, and $382.70, set on October 9. The intraday extremes over the same stretch were $345.88 on September 30 and $388.56 on October 9. Friday's $354.72 close finished $1.88 above the lower edge of the closing range, and the $349.33 low slipped under that edge on an intraday basis without reaching the September 30 low.
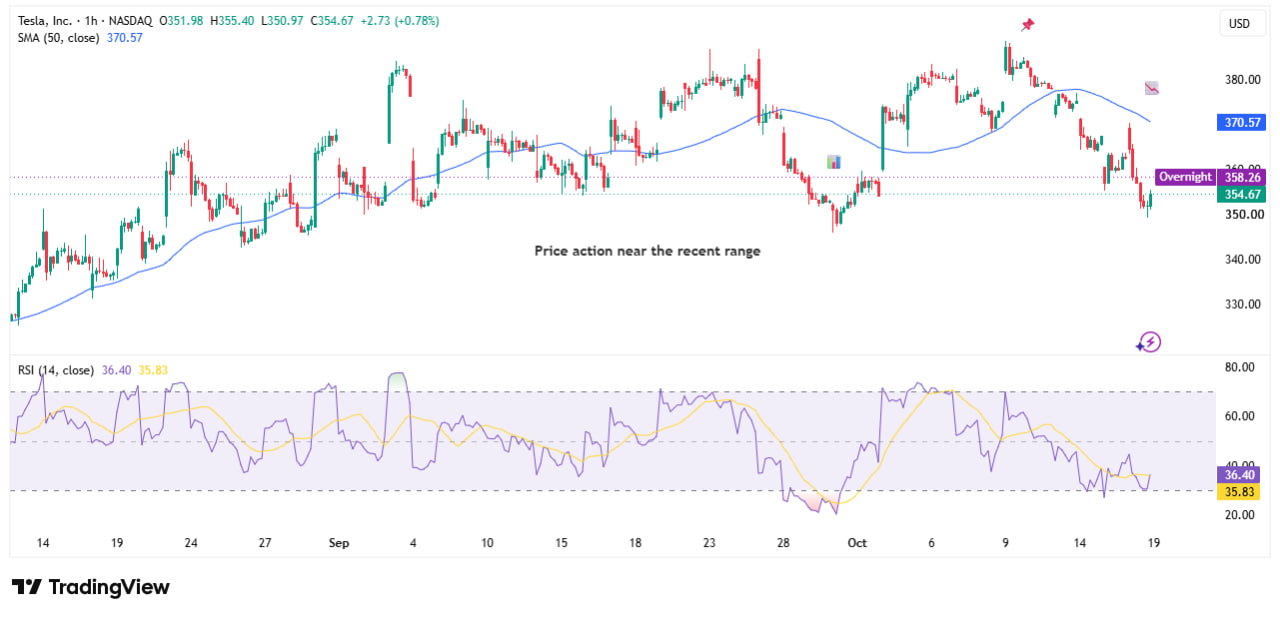
Volatility is the second half of the story. Friday's intraday range of $21.17, from $370.50 to $349.33, equals about 5.97% of the closing price, the widest of the 50 sessions in the window. The next widest was August 31, at about 5.92%, followed by August 21 at about 5.40%. The average range across the period is about 3.1%, and the average over the 20 sessions before the last five is about 2.7%. Four sessions in the window produced daily closing moves of 5% or more: August 21 (+5.14%), August 31 (+5.51%), September 3 (+5.42%) and September 4 (-5.92%). Twelve of the 49 daily changes were 3% or larger in either direction.
Calculated from daily closes, Tesla's 20-day simple moving average sits near $370.33 and its 50-day near $359.46. Friday's close was about 4.2% below the shorter average and about 1.3% below the longer one. The stock closed at $328.58 on August 7, the first day of the window, so it remains about 8% above that level.
The longer view puts the move in context. Tesla's 52-week high is $498.83, set in December 2025, and its 52-week low is $297.38, set in July 2026. At $354.72, the stock is about 28.9% below the high and about 19.3% above the low.
Competing Interpretations: Range Floor Versus Breakdown
The range floor reading. Bulls point out that the closing floor has held for 34 sessions, and Friday's close stayed above it by $1.88. The low of $349.33 also stayed above the September 30 low of $345.88, the lowest price of the stretch. Fundamentally, the October 2 report showed deliveries 5% above the company-compiled consensus, and storage deployments reached 13.7 GWh. The Roadster gave the stock a talking point heading into earnings, and the Friday close finished about 1.5% above the session low.
The breakdown reading. Bears see five straight declines, a close below both the 20-day and 50-day averages, and the widest trading range of the past 50 sessions on the third-heaviest volume. They note that the Roadster demonstration produced a gap higher at the open that faded almost completely, and that production is not planned until 2028 with no price announced. Deliveries were also about 2.1% lower than a year earlier. Under this reading, the closing floor is simply the next place the market gets tested, and a wide range suggests sellers were active throughout the session.
Both camps are using the same numbers. The disagreement is about whether Friday's volatility was a final flush toward support or the start of a wider move, and the October 21 report is the next test.
Risk Implications for Traders
Three kinds of risk stand out. The first is event risk. Tesla reports after the close on Wednesday, October 21, so the first regular session to react is Thursday, October 22. A stock that just traded a 6% intraday range can gap meaningfully in either direction on a print.
The second is sector risk. The Nasdaq Composite fell 4.5% for the week, and chip stocks led Friday's selling. Tesla traded with the broader technology group, so moves in AI-related sentiment can affect it independent of company news.
The third is level risk. The $352.84 closing floor is a price that market participants can see on any chart, so reactions near it can be sharp in either direction. Context matters too. Even after the week's decline, the stock sits about 8% above its August 7 close and about 19.3% above its 52-week low. This article is informational and is not financial advice.
Conclusion
Tesla enters the final stretch before earnings with its price and its volatility pressing on the same area. The stock closed at $354.72, just $1.88 above a closing floor that has held for 34 sessions, after the widest trading range of the past 50 sessions and a five-session losing streak. At the same time, the operating update on October 2 showed deliveries 5% above consensus, and the Roadster has given the company a fresh product story. The October 21 report is the next test. Do you think Tesla's range floor can hold through earnings, or does Friday's volatility signal that a wider move is coming?
Frequently Asked Questions About TSLA Stock
Q: Why did Tesla stock fall on October 16, 2026?
A: Tesla closed at $354.72, down 2.13%, after gapping up at the open following the Roadster demonstration and then selling off to $349.33. It was the fifth straight daily decline, and the Nasdaq Composite also fell 2.1% that day.
Q: What is Tesla's range floor?
A: Every close since August 31 has landed between $352.84 and $382.70. The lower edge was set on September 29, and Friday's close finished $1.88 above it.
Q: When does Tesla report third-quarter 2026 earnings?
A: Tesla will post results after the market closes on Wednesday, October 21, 2026, with a live webcast at 5:30 p.m. Eastern time.
Q: How many vehicles did Tesla deliver in the third quarter of 2026?
A: Tesla delivered 486,532 vehicles and produced 464,391, with 13.7 GWh of energy storage deployed. Deliveries beat the company-compiled consensus of 461,974 by 24,558.
Q: When will the new Tesla Roadster go into production?
A: Elon Musk said production would begin in 2028 during the October 15 demonstration. No price was announced.