

BNB price outlook as it sits above descending channel resistance
BNB price fell over 2% to $600 after paring some of its gains from Wednesday’s rebound. The level marks a key resistance as it aligns with the upper boundary of a descending channel pattern it had previously traded within.
- BNB fell around 4% to the $600 level, a key psychological zone that has acted as resistance and now serves as a critical pivot.
- Price action remains within a descending channel structure, with a break below $600 risking a return to the broader downtrend.
According to data from crypto.news, BNB (BNB) price fell 4% to $600 on Thursday, a key psychological level that had previously formed a significant resistance point for the asset.
The daily chart shows that BNB price has formed a descending channel pattern since mid-March this year, which is often associated with a period of consolidation or a gradual bearish trend.
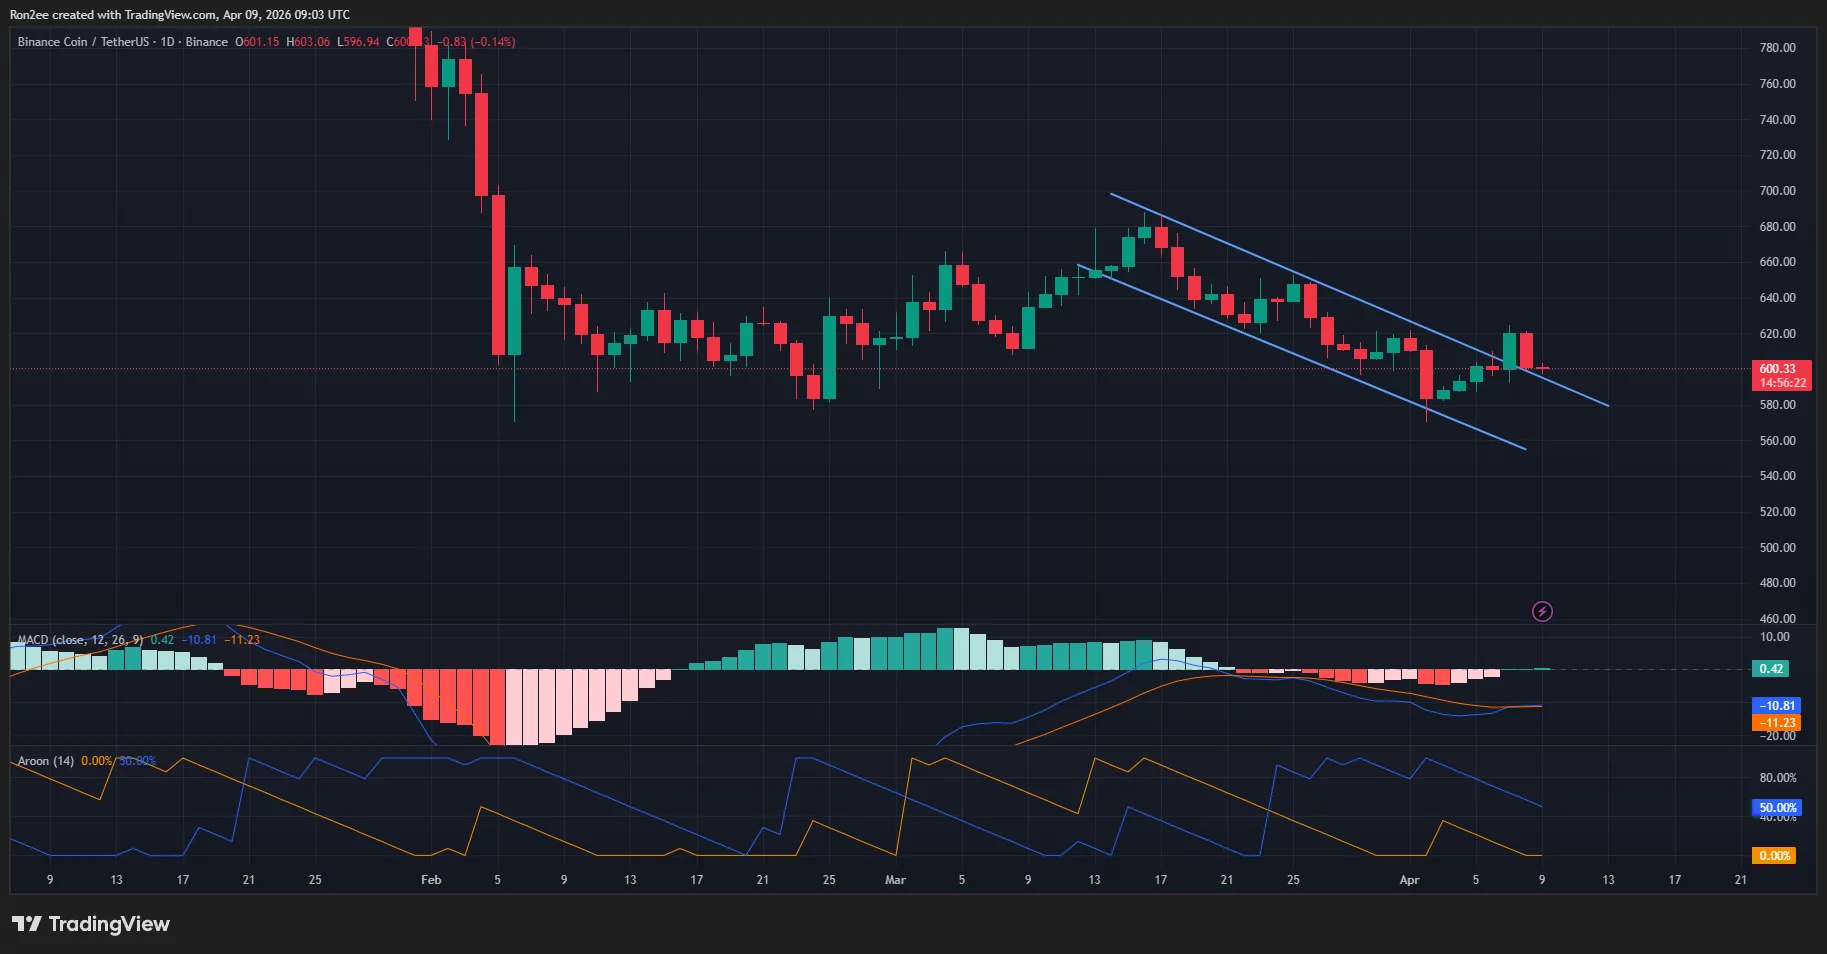
BNB price broke above the channel resistance on April 7 as the crypto market saw a brief recovery. However, it recently fell back towards the upper trend line of the pattern, which now forms an active dynamic support zone for the bulls.
If bears prevail, BNB price could fall back into the channel and thus resume its downtrend again. This remains highly possible, especially amid the uncertainty in the crypto market due to investor concerns surrounding the Middle East conflict, which has not yet been permanently settled.
However, if BNB price rebounds above $600, it could establish this level as strong support and help in driving a new rally, especially if investor demand for risk appetite assets increases.
Technical indicators present a mixed perspective of the current market direction. Notably, the MACD lines show a slight bullish bias with the MACD line eyeing a potential crossover of the signal line. Conversely, the Aroon Down still sits much higher than the Aroon Up, suggesting that bearish momentum is still a dominant force in the short term.
For now, $600 stands as the most crucial pivot point that traders will be watching closely. A sharp drop below this psychological mark could trigger bearish sentiment among traders and likely lead to further sell-offs.
On the other hand, if BNB price holds above this level, bulls could attempt to push it out of its range and drive a rally toward $700 as conditions stabilize.
Disclosure: This article does not represent investment advice. The content and materials featured on this page are for educational purposes only.


You May Also Like

Not a loophole: Singapore AI export controls let China tap US AI legally

Bitcoin, Gold, and U.S. Stocks Dive as Trump Pledges to Hit Iran ‘Extremely Hard’

Iran’s army chief warns of ‘total destruction’ for ground invasion


