

Crypto Price Prediction for Today, April 14: Kaspa (KAS), XRP, Dogecoin (DOGE)
Kaspa, XRP, and Dogecoin are all trying to recover from recent pressure, but none of them has fully escaped the bigger bearish structure yet. The latest readings show mild strength across all three assets, though the move still looks more like a recovery attempt than a full trend reversal.
That makes today’s session important because each coin is now trading close to levels that could decide whether buyers gain more control or price slips back into support zones.
Kaspa Price Action Shows a Mild Recovery From Recent Lows
Kaspa trades around $0.033 after gaining about 3.57% over the last 24 hours. That move matters because it pushed KAS slightly above its 7-day moving average near $0.0325. Even so, price remains below the 30-day and 200-day moving averages, which means the bigger structure still points lower despite this short-term rebound.
The RSI near 51 shows neutral momentum. The MACD histogram is slightly positive, which supports the idea that bearish pressure has eased for now. This does not look like a breakout move yet. It looks more like price is trying to lift itself off the recent low near $0.030 after a period of weakness.
Kaspa Tabular Snapshot
| Metric | Kaspa (KAS) |
|---|---|
| Current Price | $0.033 |
| 24 Hour Change | 3.57% |
| 7 Day MA | $0.0325 |
| 30 Day MA | Below current price ceiling |
| 200 Day MA | Above current price |
| RSI 14 | 51 |
| MACD Histogram | Slightly positive |
Kaspa Key Levels And Outlook For Today
The $0.029 to $0.031 zone remains the most important support area for KAS price today. This region has held for a long time, and the current setup still supports the idea that any move back into the broader $0.03 region could attract buyers again. A deeper break below that zone does not look like the base expectation for today.
Resistance is now close to $0.0333. A clean move above that level could push KAS toward $0.0347 and then $0.036. Those upside targets only become realistic if buyers keep control after the recent bounce.
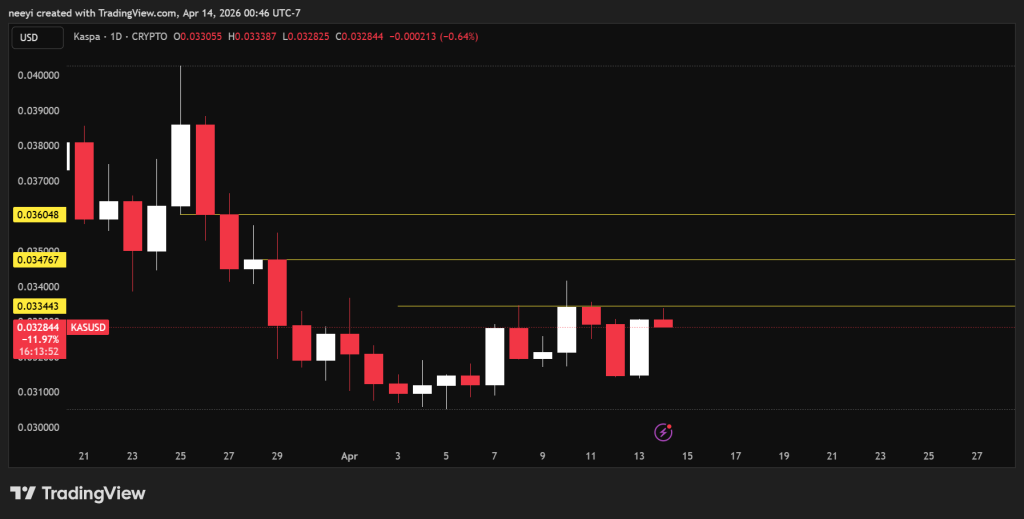 KAS Price Chart / Source: TradingView.com
Kaspa Price Prediction For Today
Today’s outlook remains open. The indicators do not show a strong one way trend. The most likely path is a test of nearby resistance first.
- A break above $0.0333 could send KAS toward $0.034 and $0.036.
- A weaker session could drag price back toward $0.031, where support is expected to hold again.
XRP Price Tries To Rebuild But Faces A Familiar Barrier
XRP trades near $1.37 after rising about 2.58% over the last 24 hours. Price now sits a little above the 7-day average near $1.35 and close to the 30-day average near $1.38. The 200-day average is still much higher near $1.93, which shows that XRP has improved in the short term but still trades inside a larger downtrend.
Momentum readings are steady but not overheated. RSI near 52 points to a balanced market with a slight bullish lean. The positive MACD histogram supports the same idea. Yesterday’s move looked controlled and gradual. XRP is trying to rebuild after earlier drawdowns, though it has not yet delivered the kind of move that confirms a stronger trend change.
| Metric | XRP |
|---|---|
| Current Price | $1.37 |
| 24 Hour Change | 2.58% |
| 7 Day Average | $1.35 |
| 30 Day Average | $1.38 |
| 200 Day Average | $1.93 |
| RSI 14 | 52 |
| MACD Histogram | Positive |
XRP Key Levels And Outlook For Today
The key level for XRP is $1.38. Price is trading just below it, which makes this area the main decision point for today. A break above $1.38 could open the way toward $1.43. That resistance has held since March 27, so buyers still need to prove they can clear it with enough strength.
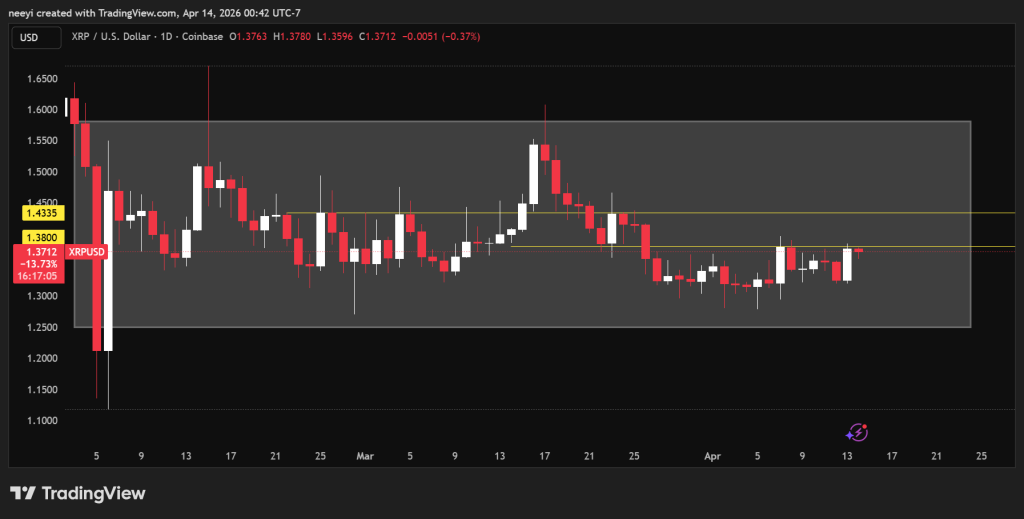 XRP Price Chart / Source: TradingView.com
Failure at $1.38 could push XRP back toward $1.32. That level already acted as support during the last 2 sessions, so it remains the main downside area to watch.
XRP Price Projection For Today
The expected range for today sits between $1.32 and $1.43.
- A stronger bullish move above $1.38 could open the path to $1.43.
- Another rejection at that same level could pull XRP back to $1.32 again before the day ends.
Dogecoin Price Remains Trapped Inside A Tight Wedge Pattern
Dogecoin trades near $0.0932 after gaining about 1.99% over the last 24 hours. Price is sitting almost exactly on top of both the 7-day and 30-day moving averages, which are clustered around $0.093 to $0.0933. That tells us DOGE is in consolidation mode.
The 200-day average near $0.139 remains far above current price, so the broader trend still leans bearish even though short-term conditions have become steadier.
RSI near 52 and a positive MACD histogram both support slight bullish pressure. Even so, the structure still looks quiet and compressed.
Dogecoin has not shown the kind of aggressive move that usually defines a strong meme coin breakout. Price is moving inside a wedge, and that pattern shows tightening conditions ahead of a bigger move.
| Metric | Dogecoin (DOGE) |
|---|---|
| Current Price | $0.0932 |
| 24 Hour Change | 1.99% |
| 7 Day MA | About $0.093 |
| 30 Day MA | About $0.0933 |
| 200 Day MA | $0.139 |
| RSI 14 | 52 |
| MACD Histogram | Positive |
Dogecoin Outlook And Key Levels For Today
The wedge pattern has defined DOGE trading for the week. That keeps today’s likely range between $0.09 and $0.095 unless a breakout appears. Price does not have a clear directional edge yet, so range trading remains the main expectation for now.
A bullish break from the wedge could open the way to $0.096 first, then $0.10, and possibly $0.11 if momentum expands sharply. A bearish break below the wedge could send DOGE back toward the upper $0.08 region.
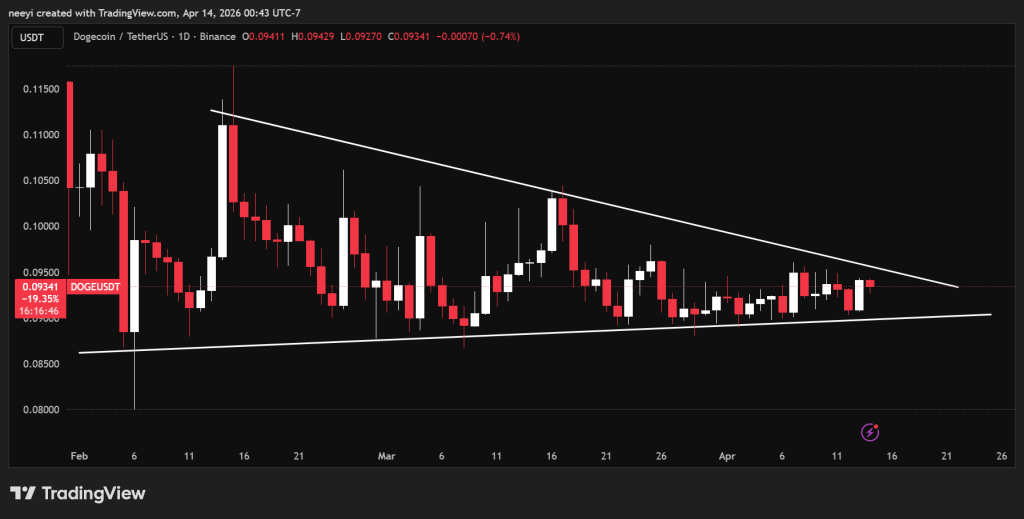 DOGE Price Chart / Source: TradingView.com
Dogecoin Price Prediction For Today
- The most likely move today is continued sideways trading inside the wedge. That points to another session around the $0.09 zone unless price breaks out.
- The bullish case opens above $0.095 and then aims for $0.096, $0.10, and $0.11.
- The bearish case appears if DOGE loses wedge support and slides back toward the upper $0.08 area.
Subscribe to our YouTube channel for daily crypto updates, market insights, and expert analysis.
The post Crypto Price Prediction for Today, April 14: Kaspa (KAS), XRP, Dogecoin (DOGE) appeared first on CaptainAltcoin.


You May Also Like

TRON Price Holds as 55B TRX Burned and Pepeto Builds Early Entry Windo

Solana crosses $1 trillion in quarterly economic activity for the first time


