Ethereum (ETH) trades near $4,200 after a 20% drop, with analysts pointing to key patterns and Q4 strength for a potential breakout.Ethereum (ETH) trades near $4,200 after a 20% drop, with analysts pointing to key patterns and Q4 strength for a potential breakout.

Buy the Dip? ETH Hits Key Support as Q4 Rally Looms

TL;DR

  • Ethereum holds $4,100 support while falling wedge and Wyckoff setup hint at strong upside potential.
  • Price compression near 20-week MA builds, with eyes on $3,550–$3,750 as key dip zone.
  • ETH Q4 rallies in 2017 and 2020 suggest seasonal strength may repeat in late 2025.

Pullback Tests Support as Compression Builds

Ethereum (ETH) is trading near $4,200 after a sharp decline from recent highs close to $4,950. The correction puts the asset down nearly 20% from its peak. Despite the drop, some market participants are watching key price levels as potential areas of interest.

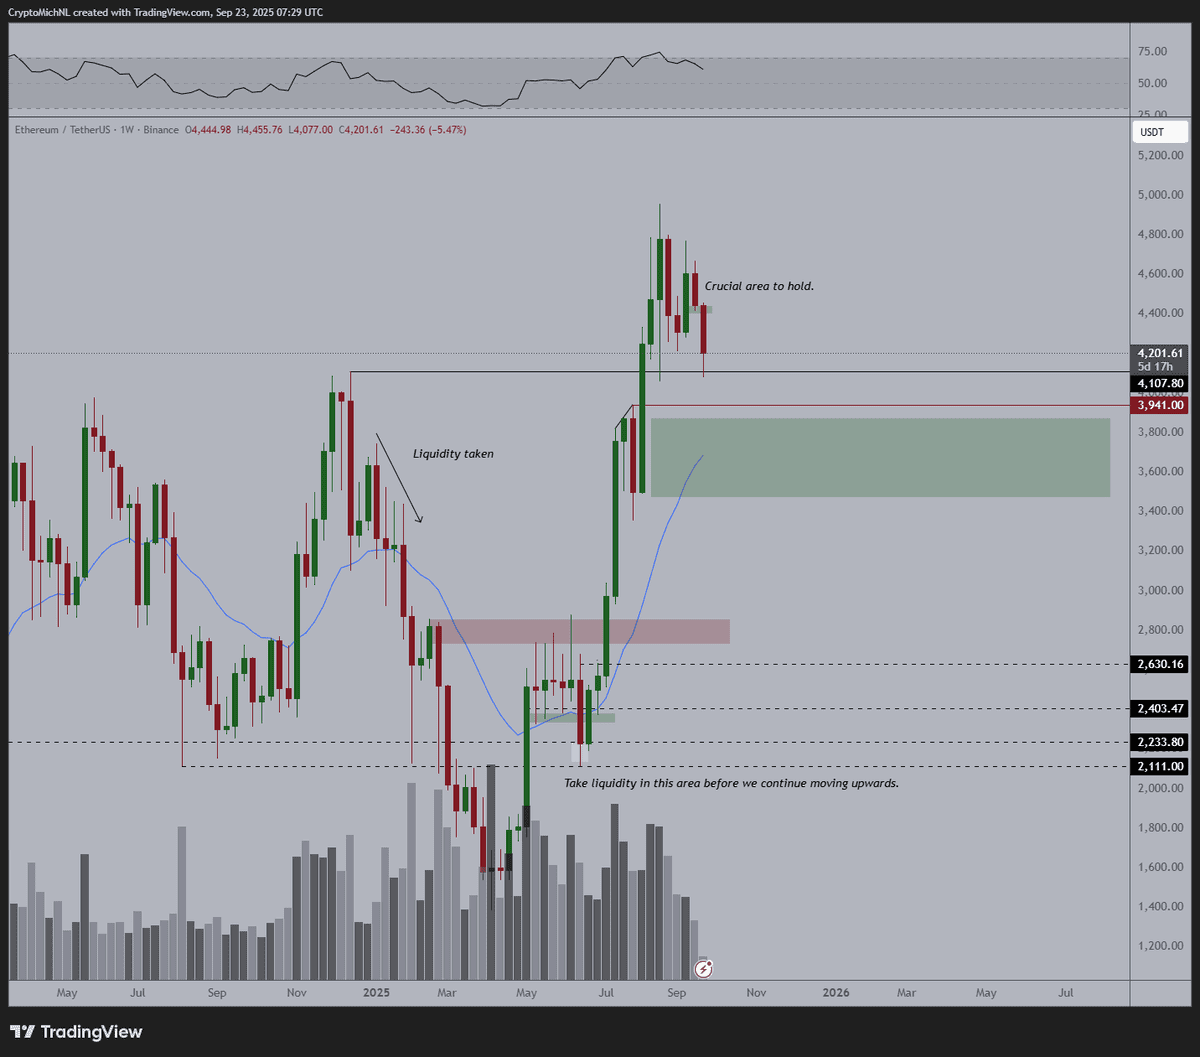
Michaël van de Poppe, a market analyst, notes that Ethereum may enter a sideways period. He points out that the 20-week moving average is now approaching the price, and compression is forming.

He stated, “I don’t know whether we’ll dip as deep as $3,550–$3,750,” leaving open the possibility for a move into that range but not confirming it. The zone between $3,550 and $3,750 is marked as potential support, close to the rising 20-week MA.

ETH price chartSource: Michaël van de Poppe/X

On the weekly timeframe chart, ETH’s price keeps holding above $4,100 as a critical zone. Just below lies a wider support area that rests between $3,550 and $3,750, aligning with a former breakout area and the 20-week moving average. A green support box also appears lower on the chart as a historical consolidation area around $2,800.

Past moves show that ETH has responded to these levels. Labels such as “liquidity taken” at $3,900 and “take liquidity in this area” near $2,800 suggest that if the price revisits those levels, reactions could follow. Lower volume in recent weeks supports the idea that price may be preparing for a more directional move.

Chart Structures Point to a Setup

Another pattern on the chart comes from Trader Tardigrade, who points to a falling wedge. The setup is clear, with the asset trending within two downward lines. The falling wedge is near its apex, and the price is testing previous breakout levels. The chart includes a possible move toward $6,800 if it breaks above the wedge.

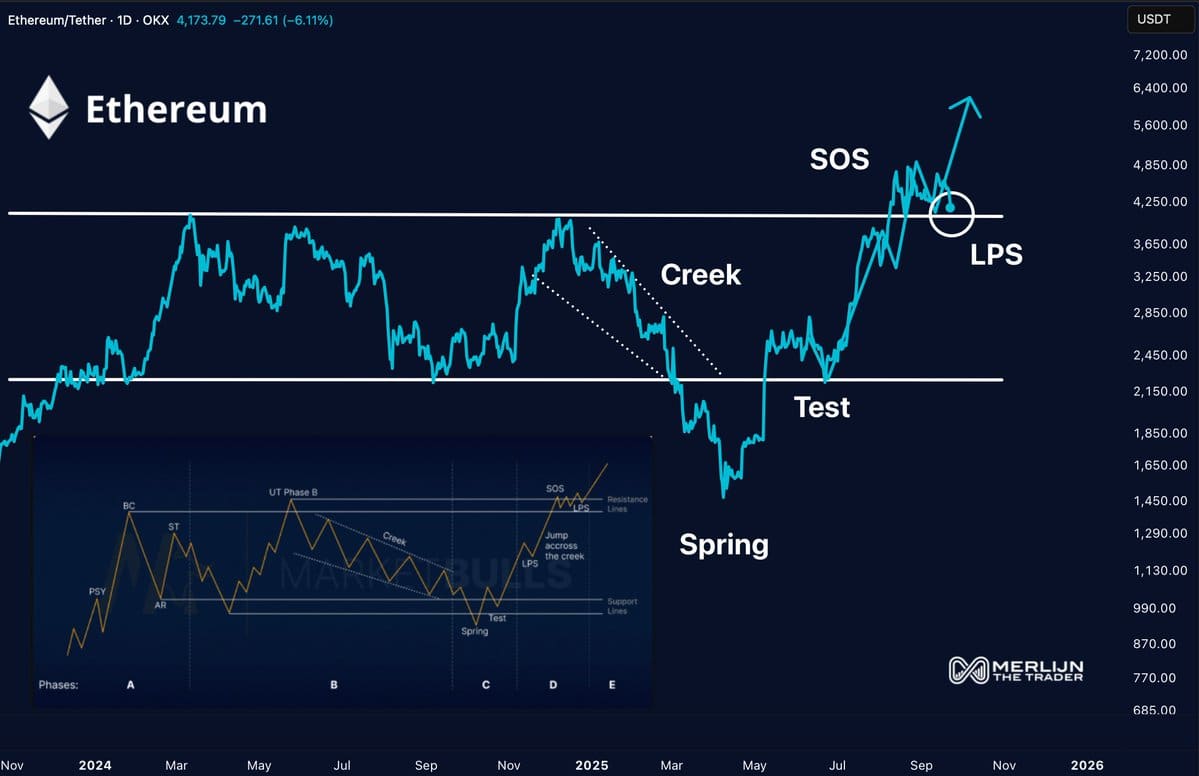
Separately, Merlijn The Trader uses the Wyckoff model to describe ETH’s movement. The model shows that Ether may have completed its Spring, Test, and Sign of Strength phases. It is now in what’s labeled as the Last Point of Support, a position in the structure where stronger upward movement often begins. “This is where Ethereum accelerates into five digits,” he wrote, pointing to the next phase of the cycle.

ETH price chartSource: Merlijn The Trader/X

Q4 Setup Resembles Previous Cycles

Ethereum has had a strong fourth-quarter performance during past bull runs. In 2017, it gained over 140% in Q4. In 2020, these returns were above 100%. This year, ETH saw a drop of -45.41% in Q1 but recovered in Q2 (+36.48%) and Q3 (+79.55%).

Crypto Rand referred to these figures and asked,

The recent rebound and historical Q4 strength have led to comparisons with those cycles. While no outcome is guaranteed, traders are watching to see if a similar trend develops.

The post Buy the Dip? ETH Hits Key Support as Q4 Rally Looms appeared first on CryptoPotato.

Market Opportunity
NEAR Logo
NEAR Price(NEAR)
$1.503
$1.503$1.503
-3.15%
USD
NEAR (NEAR) Live Price Chart
Disclaimer: The articles reposted on this site are sourced from public platforms and are provided for informational purposes only. They do not necessarily reflect the views of MEXC. All rights remain with the original authors. If you believe any content infringes on third-party rights, please contact service@support.mexc.com for removal. MEXC makes no guarantees regarding the accuracy, completeness, or timeliness of the content and is not responsible for any actions taken based on the information provided. The content does not constitute financial, legal, or other professional advice, nor should it be considered a recommendation or endorsement by MEXC.

You May Also Like

Tether CEO Delivers Rare Bitcoin Price Comment

Tether CEO Delivers Rare Bitcoin Price Comment

Bitcoin price receives rare acknowledgement from Tether CEO Ardoino
Share
Coinstats2025/09/17 23:39
Zepto Life Technology Launches Plasma-Based FungiFlex® Mold Panel as CLIA Reference Laboratory Test

Zepto Life Technology Launches Plasma-Based FungiFlex® Mold Panel as CLIA Reference Laboratory Test

ST. PAUL, Minn., Jan. 21, 2026 /PRNewswire/ — Zepto Life Technology has announced the launch of the FungiFlex® Mold Panel, a plasma-based molecular diagnostic test
Share
AI Journal2026/01/21 23:47
Polygon Tops RWA Rankings With $1.1B in Tokenized Assets

Polygon Tops RWA Rankings With $1.1B in Tokenized Assets

The post Polygon Tops RWA Rankings With $1.1B in Tokenized Assets appeared on BitcoinEthereumNews.com. Key Notes A new report from Dune and RWA.xyz highlights Polygon’s role in the growing RWA sector. Polygon PoS currently holds $1.13 billion in RWA Total Value Locked (TVL) across 269 assets. The network holds a 62% market share of tokenized global bonds, driven by European money market funds. The Polygon POL $0.25 24h volatility: 1.4% Market cap: $2.64 B Vol. 24h: $106.17 M network is securing a significant position in the rapidly growing tokenization space, now holding over $1.13 billion in total value locked (TVL) from Real World Assets (RWAs). This development comes as the network continues to evolve, recently deploying its major “Rio” upgrade on the Amoy testnet to enhance future scaling capabilities. This information comes from a new joint report on the state of the RWA market published on Sept. 17 by blockchain analytics firm Dune and data platform RWA.xyz. The focus on RWAs is intensifying across the industry, coinciding with events like the ongoing Real-World Asset Summit in New York. Sandeep Nailwal, CEO of the Polygon Foundation, highlighted the findings via a post on X, noting that the TVL is spread across 269 assets and 2,900 holders on the Polygon PoS chain. The Dune and https://t.co/W6WSFlHoQF report on RWA is out and it shows that RWA is happening on Polygon. Here are a few highlights: – Leading in Global Bonds: Polygon holds 62% share of tokenized global bonds (driven by Spiko’s euro MMF and Cashlink euro issues) – Spiko U.S.… — Sandeep | CEO, Polygon Foundation (※,※) (@sandeepnailwal) September 17, 2025 Key Trends From the 2025 RWA Report The joint publication, titled “RWA REPORT 2025,” offers a comprehensive look into the tokenized asset landscape, which it states has grown 224% since the start of 2024. The report identifies several key trends driving this expansion. According to…
Share
BitcoinEthereumNews2025/09/18 00:40