

XRP (XRP) Faces Persistent Short Pressure: Why Bears Could Be Caught Off Guard
Key Takeaways
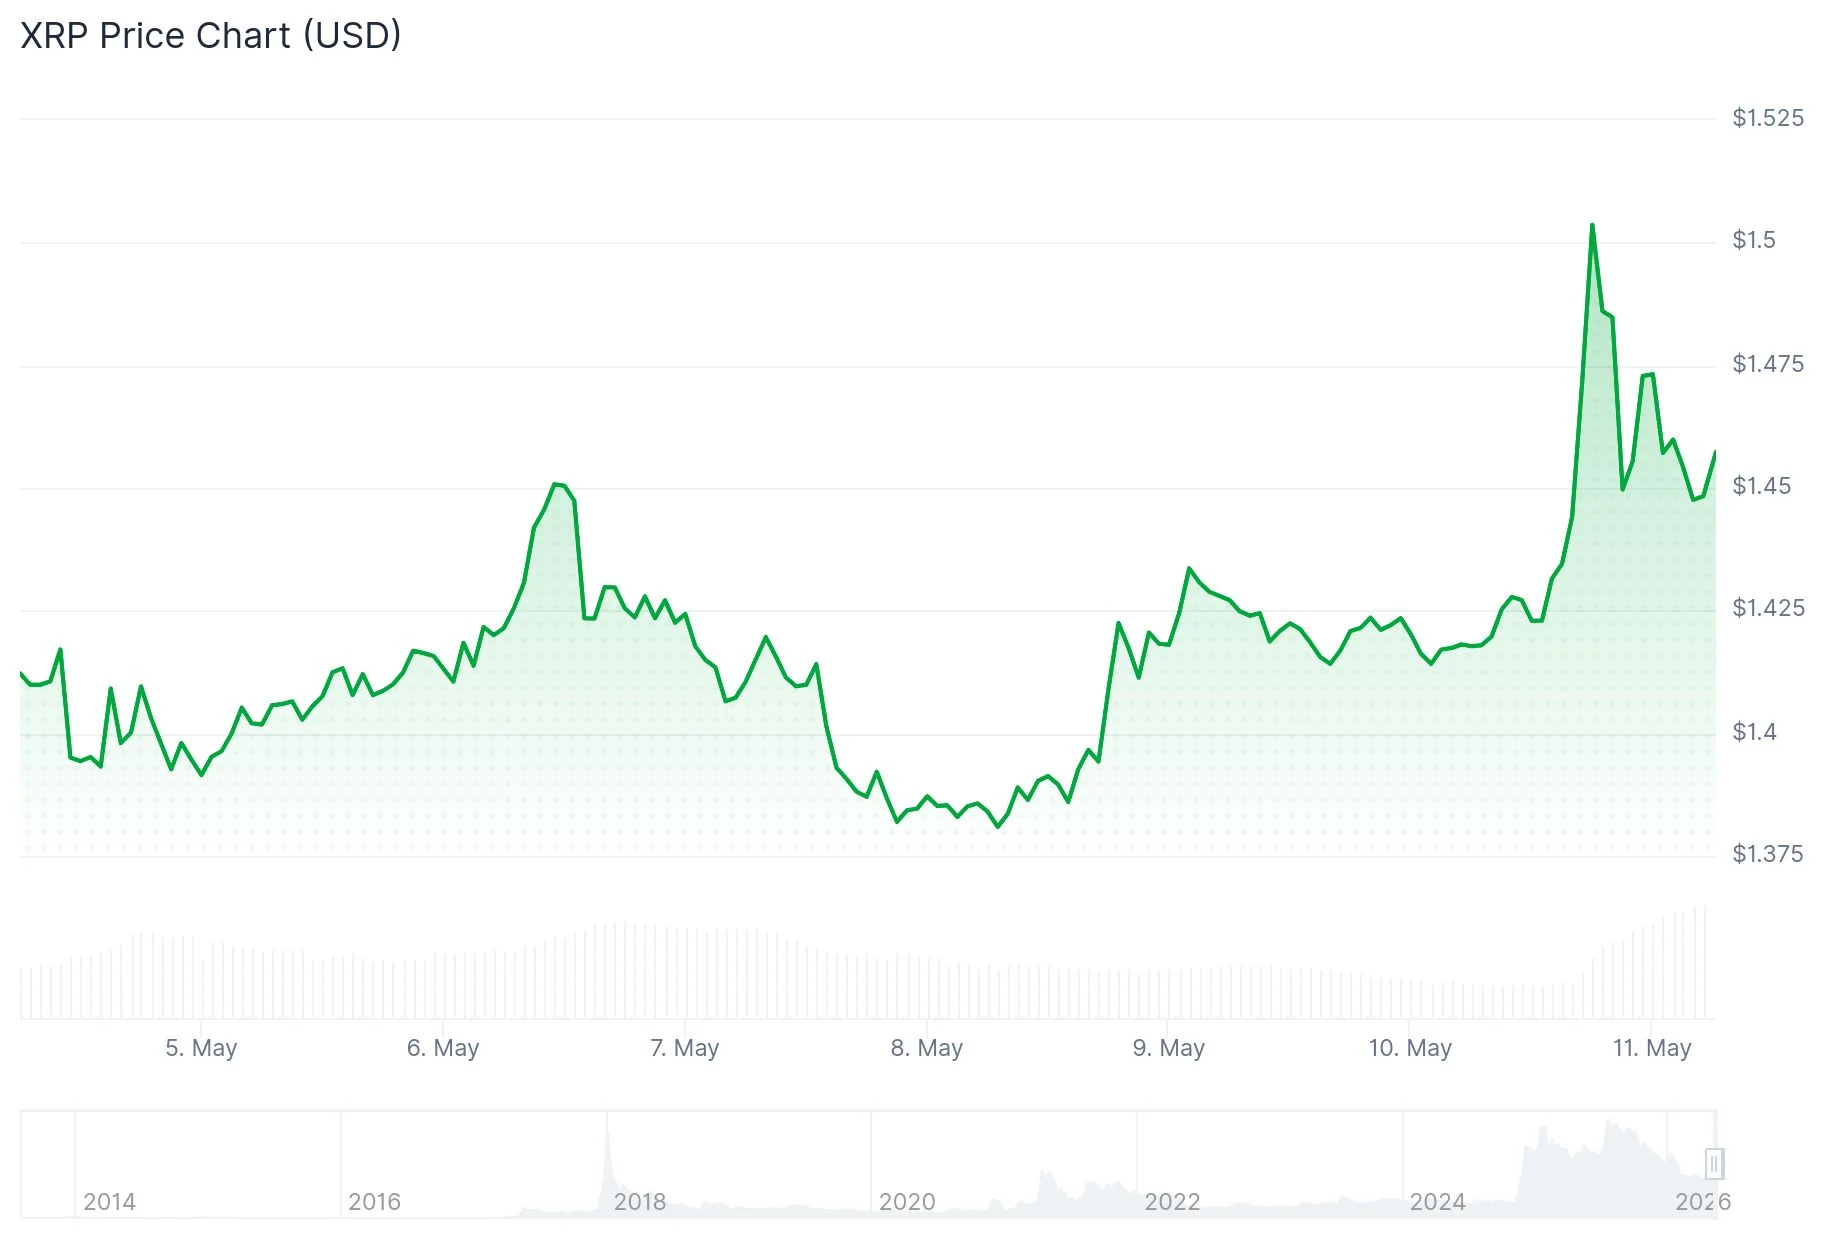
- XRP reached a peak of $1.5074 before retracing, currently hovering near $1.44
- Critical support exists at $1.4420 where a bullish trend line provides near-term floor
- Trader Darkfost highlights negative funding rates persisting for three months, drawing parallels to April 2025’s 126% surge
- Egrag Crypto identifies historical downside pattern suggesting possible macro low around $0.93
- Open interest in XRP futures climbed to $2.72 billion despite 34% drop in trading activity
XRP has experienced a notable correction following its recent advance to $1.5074, with market participants closely monitoring key technical zones that could determine whether the digital asset resumes its upward trajectory.
 XRP Price
The cryptocurrency demonstrated relative strength against both Bitcoin and Ethereum during its recent advance, pushing beyond $1.45 before encountering resistance near $1.5050. Following this peak, selling pressure emerged, driving prices below the $1.48 and $1.4620 levels, breaching the 38.2% Fibonacci retracement drawn from the $1.3786 low to the $1.5074 high.
Current market data shows XRP fluctuating in the $1.42 to $1.44 range, maintaining position above its 100-hourly Simple Moving Average. Technical chart analysis reveals an emerging bullish trend line on the hourly timeframe, providing support at the $1.4420 level.
Bulls seeking renewed upside momentum must first overcome resistance at $1.4620. Successfully clearing this barrier would expose $1.4770, followed by $1.5050. Additional resistance zones are positioned at $1.520 and $1.550.
Should support at $1.4420 fail to hold, attention shifts to $1.4280, which corresponds with the 61.8% Fibonacci retracement level. Breaking below this zone could accelerate downside toward $1.4120 and the psychological $1.40 threshold.
Extended Negative Funding Points to Potential Squeeze
Market analyst Darkfost highlighted via X that XRP’s funding rates on Binance have maintained a negative bias for approximately three months — representing the most extended bearish positioning seen in recent memory. This development is particularly noteworthy given that XRP has appreciated roughly 27% during this identical timeframe.
Darkfost referenced April 2025 as a relevant historical precedent. During that period, XRP traded around $1.25 with comparable bearish market sentiment, subsequently delivering a substantial 126% rally.
In related observations, analyst CW shared on X that sub-indicator golden crosses are materializing, characterizing a comprehensive rally as “imminent.”
Historical Cycle Analysis Suggests $0.93 Floor
Cryptocurrency analyst Egrag Crypto has directed market focus toward XRP’s weekly price structure. His analysis identifies a pattern where XRP’s cyclical bottoms have exhibited progressively smaller deviations below the 200-week Simple Moving Average — approximately 60% below during the initial cycle, declining to 40% in the subsequent cycle.
Extending this pattern forward suggests the next cyclical low could materialize around 20% beneath the 200-week SMA, translating to approximately $0.93. Egrag emphasized this represents a “logical structure” rather than a guaranteed floor.
XRP continues to respect its long-term ascending trendline when viewed on weekly charts.
Derivatives market data from CoinGlass indicates futures volume contracted 34% to $2.05 billion, while open interest expanded 1.05% reaching $2.72 billion. The open interest-weighted funding rate registered at 0.0052%, reflecting marginally positive positioning.
According to CoinMarketCap, XRP’s 24-hour trading volume totaled $1.2 billion, representing a 30.48% decrease from prior levels.
The post XRP (XRP) Faces Persistent Short Pressure: Why Bears Could Be Caught Off Guard appeared first on Blockonomi.


You May Also Like

Spartans.com Joins the Elite Top 10 Global Casinos – The Massive $7M Leaderboard Payout Proves Its Power
Trump team making easily avoidable mistake that could undermine assassination case: expert


