SoftBank Stock holds bullish trend as hourly momentum cools

SoftBank Stock (SFTBY) remains in a bullish daily trend, while near-term momentum has cooled. The setup still favors upside on the higher timeframe, as the hourly picture argues for a pause or shallow pullback before any next leg.
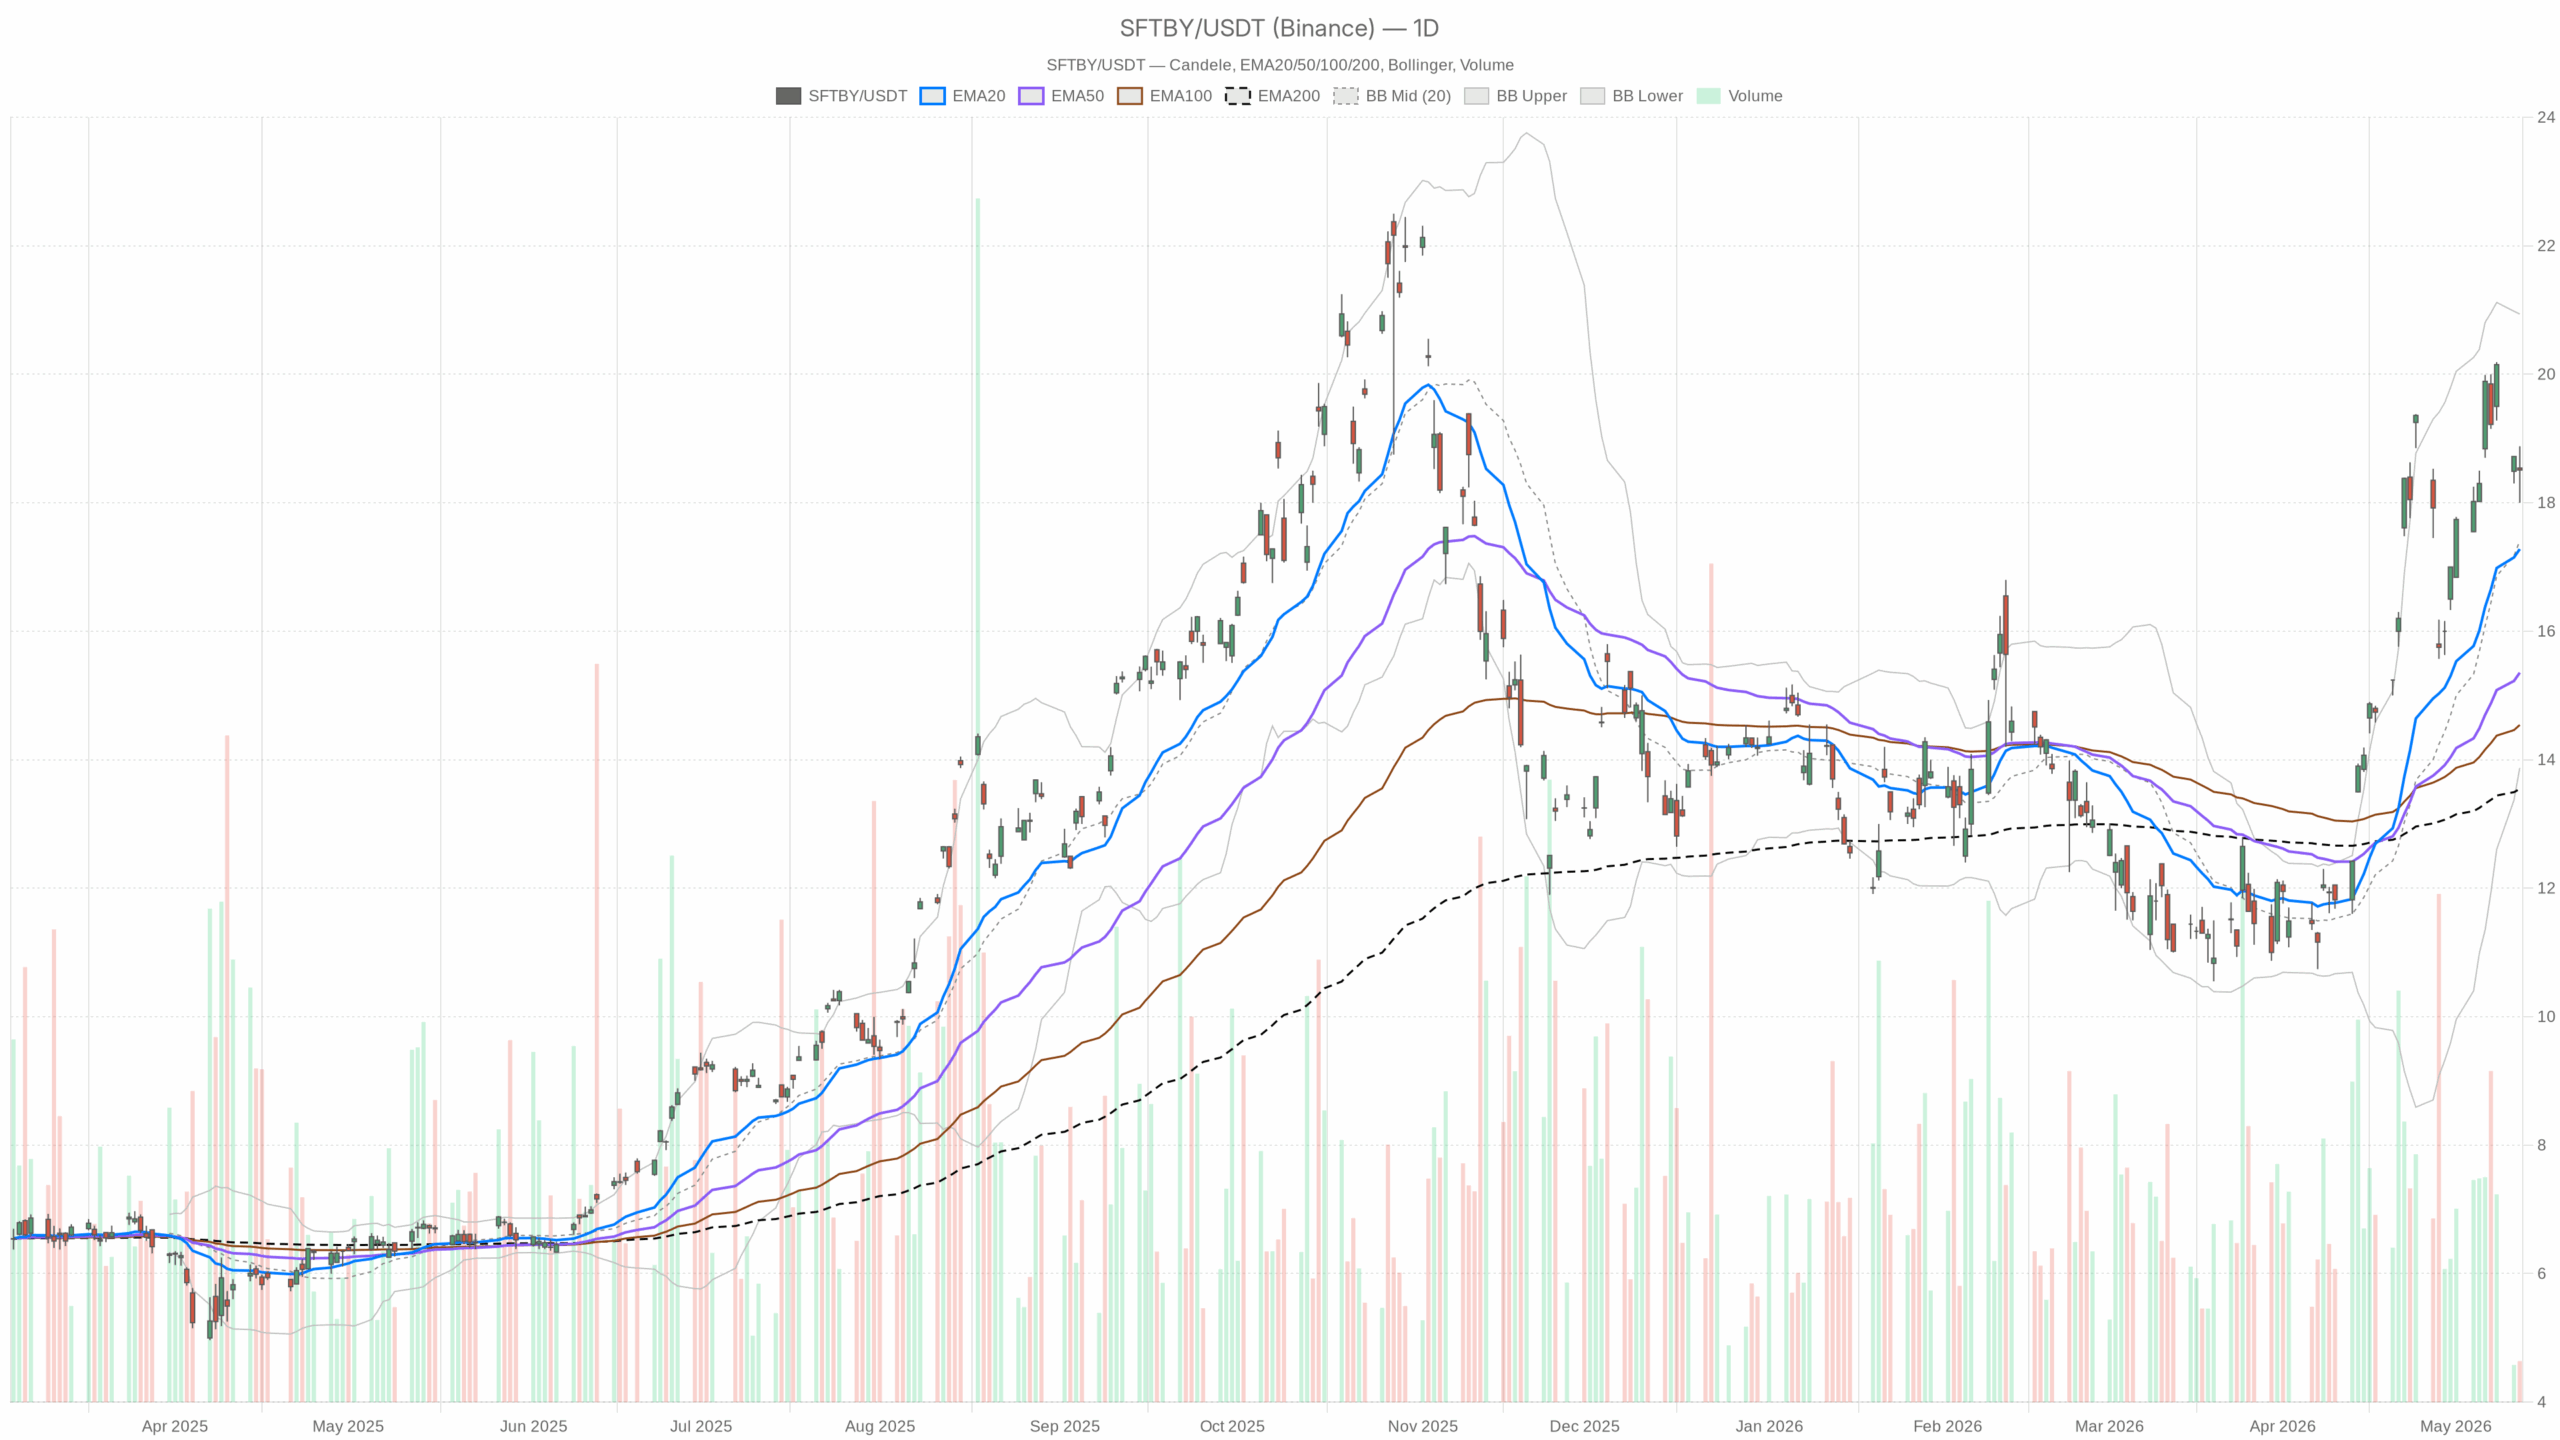 SFTBY — daily chart with candlesticks, EMA20/EMA50 and volume.
SoftBank Stock daily trend remains bullish
Trend and moving averages
On the daily chart, price closed at 18.51, well above the 20/50/200-day EMAs at 17.28, 15.36, and 13.55. Interpretation: the primary trend is firmly higher, and buyers still control the tape.
Momentum and volatility context
The daily RSI(14) sits at 59.3. Interpretation: momentum is positive without being stretched. The daily MACD shows a small positive histogram at 0.03 with the line just above the signal. Interpretation: upside momentum persists but is losing thrust. Daily Bollinger Bands center on 17.41 with an upper band at 20.94. Interpretation: price has room to extend higher within the band. The ATR(14) is 1.17. Interpretation: daily volatility is elevated and swings can be wider than usual.
Daily pivot map
The daily pivot sits at 18.46 with R1 at 18.93 and S1 at 18.05. Interpretation: the close just above the pivot points to support near 18.46 and resistance into 18.93.
Hourly momentum has softened in SFTBY
Moving averages and structure
Price ended at 18.51 with the 20-hour EMA at 18.71 and the 50-hour EMA at 18.60 overhead, while the 200-hour EMA lags at 16.32. Interpretation: short-term moving averages cap price and signal consolidation within a longer uptrend.
Oscillators and bands
The hourly RSI(14) prints 44.5. Interpretation: near-term momentum is soft and sub-50. The hourly MACD is negative with a -0.08 histogram. Interpretation: bears have a marginal intraday edge for now. Hourly Bollinger Bands center on 18.94. Interpretation: price trades in the lower half of the band and lacks immediate thrust. The hourly ATR is 0.35. Interpretation: intraday ranges are active but manageable.
Intraday pivots
The hourly pivot is 18.50 with R1 at 18.63 and S1 at 18.37. Interpretation: price is pinned near the pivot, and minor resistance stands at 18.63.
15-minute execution context: improving but capped
Moving averages and momentum
Price is 18.51 with the 15-minute EMA20 at 18.37 below and the EMA50/EMA200 at 18.57/18.58 above. Interpretation: very short-term bias is trying to turn up, but nearby moving-average resistance sits at 18.57–18.58. The 15-minute RSI is 56.7. Interpretation: intraday momentum has shifted constructive. The 15-minute MACD histogram is positive at 0.06. Interpretation: micro timeframes are attempting an upswing.
Bands, volatility, and pivots
The 15-minute Bollinger upper band is near 18.51. Interpretation: price is pressing resistance and needs a clear break to sustain follow-through. The 15-minute ATR is 0.08. Interpretation: micro volatility is tight and can precede a quick expansion. The 15-minute pivot is 18.53 with R1 at 18.60 and S1 at 18.44. Interpretation: the first hurdle sits at 18.53–18.60.
Headline risk context for SoftBank Stock
Notably, headline risk remains in focus after SoftBank reportedly cut its OpenAI-backed margin loan target to roughly $6B from $10B. Interpretation: funding appetite looks more cautious, which can temper speculative enthusiasm but also reduce balance-sheet risk if conditions tighten.
Scenarios and levels to validate the SoftBank Stock outlook
Bullish continuation trigger
Therefore, the main scenario is still bullish on the daily timeframe. A push above 18.63 on the hourly, followed by a break through the daily R1 at 18.93, would mark momentum re-acceleration. Interpretation: reclaiming hourly EMAs and clearing 18.93 would align timeframes and open space toward the daily upper Bollinger near 20.94 over time.
Bearish risk path
In contrast, a failure beneath 18.60 intraday that slips below 18.37 and then the daily S1 at 18.05 would weaken the case. Interpretation: losing 18.05 would shift risk toward a deeper pullback inside the broader trend. A daily close below the 20-day EMA at 17.28 would more clearly invalidate the bullish stance. Interpretation: such a break would hand control back to sellers on the higher timeframe.
Bottom line
Overall, positioning should respect the bullish daily regime while acknowledging hourly softness and headline uncertainty. Expect choppy action around the 18.46 pivot given the elevated ATR. At the same time, a decisive hourly turn through 18.63 would likely restore upside rhythm, while a break of 18.05 would flag a more meaningful test of trend strength.


You May Also Like

Micron and Sandisk Jump as Samsung Strike Threat Deepens Memory Chip Shortage

Morgan Stanley Raises 2026 S&P 500 Target to 8,000