

XRP Price Ready to Pop – The Longer the Range, the Bigger the Pump
The XRP price is back in focus as traders take a step back and look at its long-term structure. When you zoom out, XRP doesn’t really move in a straight line. It tends to go through big explosive rallies, followed by deep corrections, and that pattern has repeated across multiple market cycles.
After the 2017 peak, XRP dropped about 96.69%. The 2021 cycle followed the same kind of move, with a drawdown of around 95.20%. The most recent cycle from 2025 into 2026 has also cooled off, with a decline of roughly 91.20% from its highs.
Even with those heavy drawdowns, one thing has stayed consistent. The XRP price has kept finding buyers around a long-term rising support trendline that has been in play for more than a decade. That’s why some traders still view the broader structure as intact, even after years of volatility.
XRP Long-Term Structure That Keeps Repeating
We had a look at the chart shared by Versan Aljarrah. If you look at XRP’s full history from 2014 onward, the same pattern keeps showing up. A long accumulation phase builds, price breaks out, runs hard into a peak, then retraces deeply before resetting again.
The 2014 to 2017 base led into the major 2017–2018 rally. After that came a near 97% drop. The 2021 cycle followed with another strong move and another deep correction. The current cycle shows the same behavior again, with price pulling back after a strong rally and now trading closer to long-term support zones.
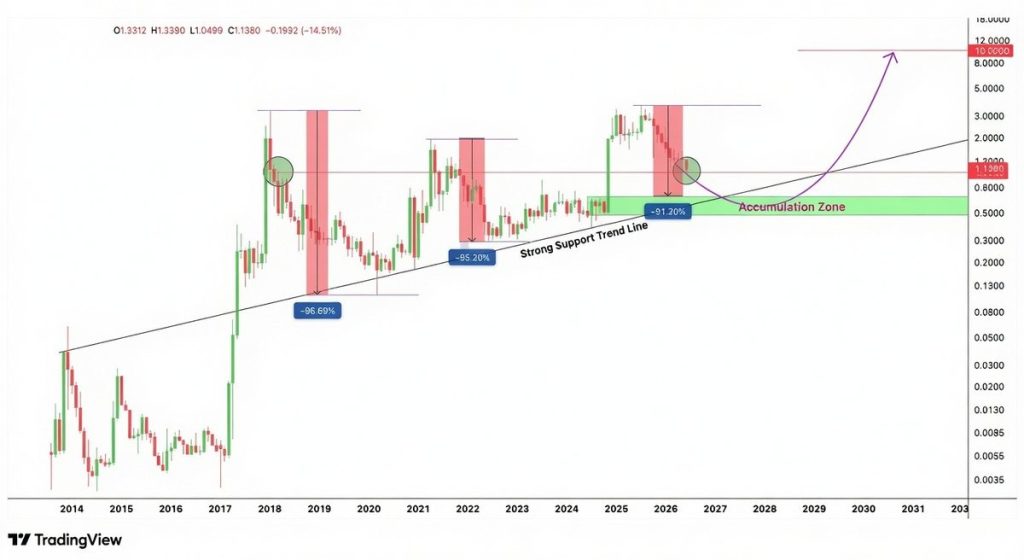 Source: X/@versanaljarrah
These repeated cycles are what traders are comparing when they talk about the XRP price today. The important factor here is not only where the price is currently located but how consistently it has honored this structure in the past.
At the moment, XRP continues trading above a large accumulation zone which has traditionally acted as an attraction point for buyers in previous cycles. This level can be roughly identified within the $0.80 – $1.20 range.
Read Also: Crypto Price Prediction for Today, June 20: Bitcoin (BTC), XRP, and Solana (SOL)
Institutional Access Through a New ETF Structure
On the institutional side, XRP is also getting a new kind of exposure channel. T. Rowe Price has received SEC approval for its Active Crypto ETF, known as TKNZ, which can hold between 5 and 15 cryptocurrencies.
XRP is one of the qualified assets in that basket along with Bitcoin, Ethereum, Solana, Cardano, Avalanche, and other digital currencies. This ETF tracks the performance of the FTSE Crypto US Listed Index, where the benchmark weight for XRP is around 11.4%.
T. Rowe Price manages close to $1.8–$1.9 trillion in assets, much of it tied to retirement and institutional portfolios. That matters because it means the XRP price is now indirectly exposed to traditional capital flows that usually don’t touch crypto exchanges.
There’s already evidence of demand too. Existing XRP-focused ETFs have recorded roughly $1.44–$1.45 billion in net inflows, showing that regulated XRP exposure is already attracting steady interest.
What This Means for the XRP Price Going Forward
The next phase depends less on headlines and more on execution. The critical factors to focus on would be the actual level of XRP holdings within the TKNZ ETF, the pattern of inflows following its debut, and the ability of XRP to maintain its position within the benchmark weighting.
Should the demand for the ETF increase and allocations remain significant, it could mean a consistent new buying pressure on XRP. At the same time, the long-term chart structure is still sitting near historically important support zones, which is why some traders are paying attention again.
For now, XRP is in a spot where both sides of the market matter. The long-term chart shows a repeating cycle structure, while institutions are slowly building new access routes through ETFs. That combination is what makes the XRP price worth watching as the next cycle develops.
FAQs

XRP holds around an 11.4% benchmark weight in the FTSE Crypto Index used by the ETF, but actual allocation depends on fund managers and inflows.
Yes. Despite institutional access and long-term adoption narratives, XRP remains a volatile asset with large historical drawdowns.
Subscribe to our YouTube channel for daily crypto updates, market insights, and expert analysis.
The post XRP Price Ready to Pop – The Longer the Range, the Bigger the Pump appeared first on CaptainAltcoin.


You May Also Like

NDPC plans review of Nigeria’s data protection Act to address AI and other emerging technologies

US VP Vance heads to Switzerland for Iran talks

Gram Network Clarifies Independent Status on TON, Warns Against Fake GRM Accounts


