

Is It Too Late To Buy Dogecoin? 3 Analysts Reveal What’s Next
Dogecoin’s spot pair is grinding higher inside a well-defined structure while its BTC cross sits at an inflection between monthly moving averages—an alignment three widely followed traders say still favors upside, provided trend supports hold.
Is It Too Late To Buy Dogecoin?
IncomeSharks’ daily chart frames the current advance as a rising channel that has been in place since early summer. Price is riding a sequence of higher lows off the June base and is now near $0.26, mid-channel, with the lower trendline rising through roughly $0.24 and the upper boundary capping rallies in the $0.33 area.
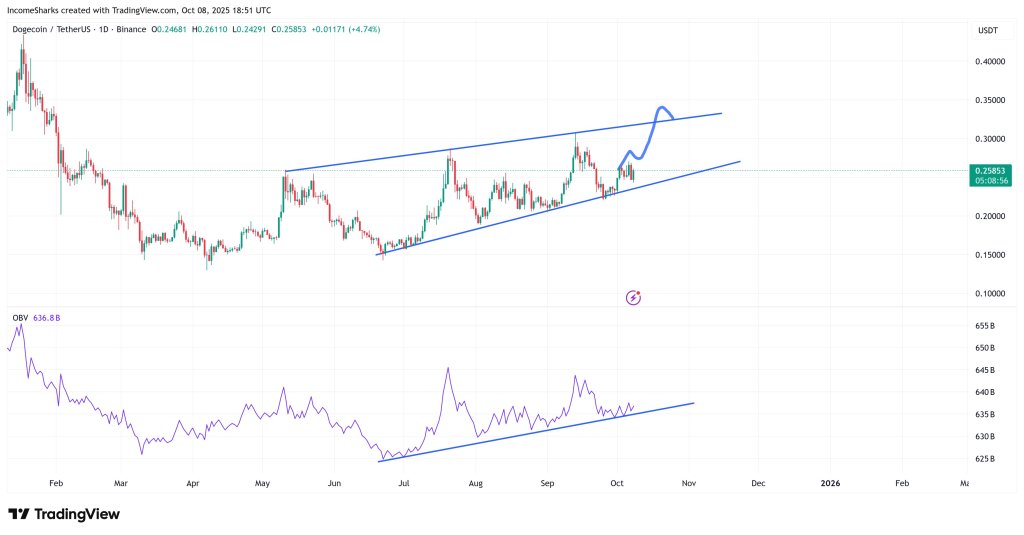
The analyst’s “squiggle” path predicted a shallow pullback to the midline followed by a drive toward the channel top, an outlook backed by an On-Balance Volume line that continues to stair-step higher along its own rising trend. In this read, $0.24 is the pivotal dynamic support; losing it would hand control back to sellers and force a reassessment of the entire channel, while holds above $0.26 reopen a test of the $0.33 line that has repeatedly capped advances.
Cantonese Cat’s daily view focuses on market structure rather than indicators. The chart traces a long, clean downtrend line from last year’s lower-high sequence—connecting the $0.48 peak through multiple failure points—now broken and back-tested. Spot is fluctuating around $0.25–$0.26 after reclaiming that diagonal, which turns prior resistance into support.
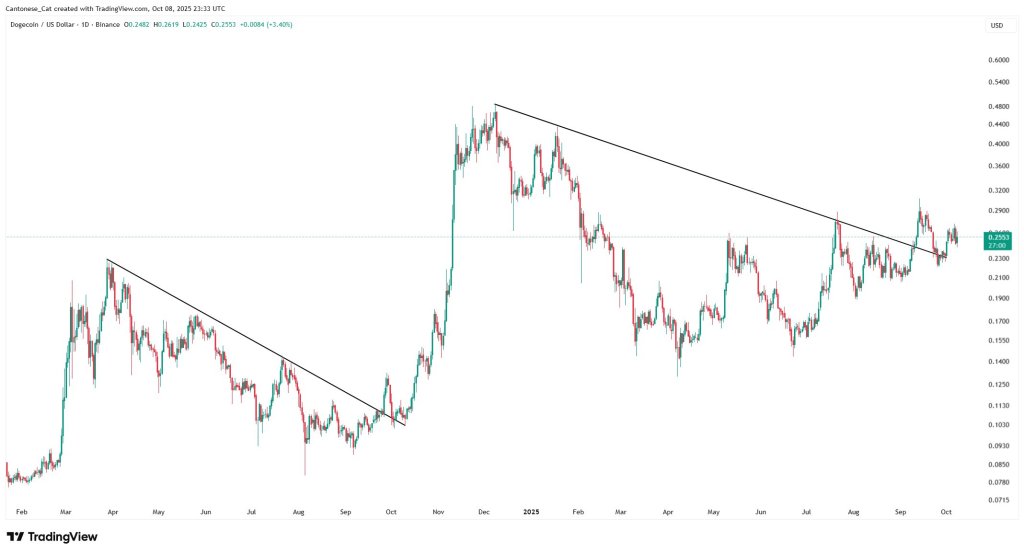
“It’ll never make sense to me why people kept saying that the cycle’s over and $DOGE is done when it’s making higher lows,” the trader writes, pointing to the serial HLs that have persisted since spring. If that staircase holds, the path of least resistance runs toward the prior local highs near $0.31, where supply rejected price in September; acceptance above that shelf would align with IncomeSharks’ channel targets.
DOGE Vs. BTC
The third lens is relative performance. Degentrading highlights DOGE/BTC as their “highest conviction trade,” adding color on why: “$doge has liquidity (so in the event I’m wrong, I don’t get raped on the way out). IF we get a breakout in BTC, Doge has historically performed extremely well. Out of all the dino coins, it is one that is also most familiar w tradfi. Seasonally, Oct is the month with the best median and decent mean returns for $doge… only negative year was in 2018.”
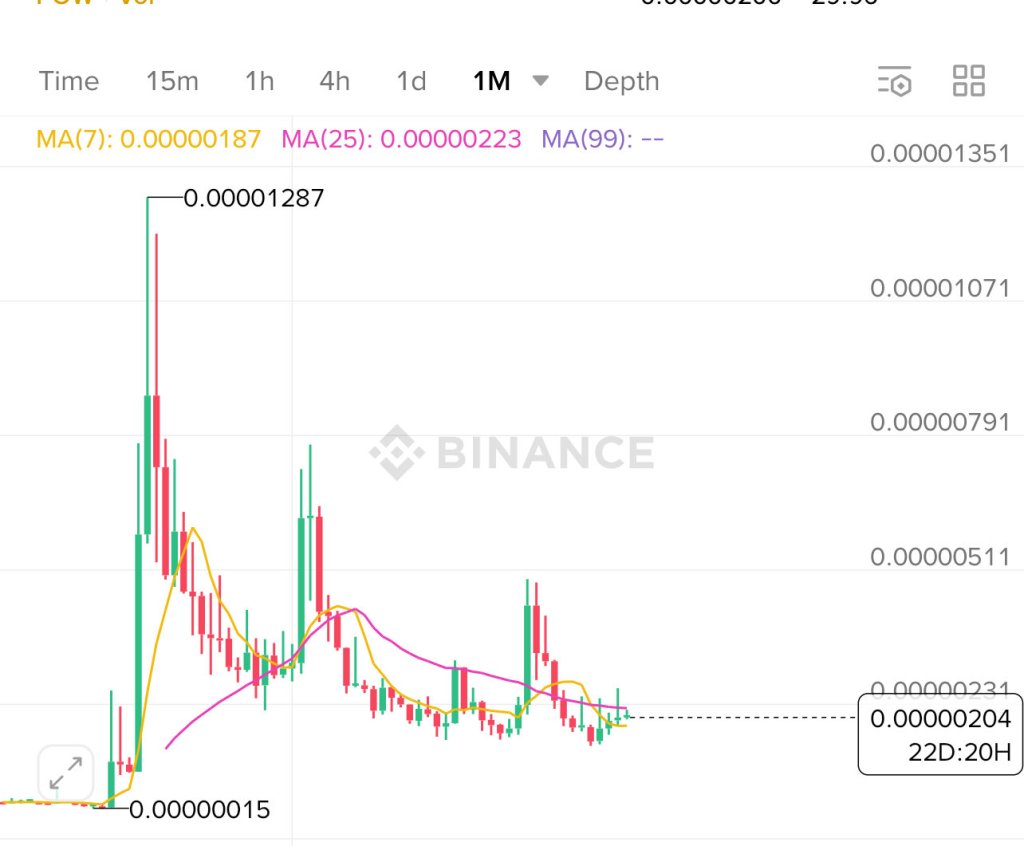
The monthly DOGE/BTC chart shows price near 0.00000204 BTC, wedged between the 7-month moving average at ~0.00000187 BTC and the 25-month moving average at ~0.00000223 BTC. That places the pair at a decision point: sustained closes above the longer MA would mark a momentum shift back toward bulls and clear the way to test stepped resistance levels printed on the chart around 0.00000231 BTC and then the mid-range clusters near 0.00000511–0.00000791 BTC, whereas rejection keeps the cross confined to its post-2024 base.
The historical blow-off high on the panel—0.00001287 BTC—illustrates the headroom if a full relative rotation develops, but the moving-average shelf is the near-term arbiter.
Across all three takes, the through-line is that Dogecoin has not broken its constructive pattern. The spot chart continues to respect a rising channel with improving OBV, the longer downtrend has been breached and retested with HLs intact, and the BTC pair sits one push below a higher-timeframe moving-average reclaim that would confirm relative strength.
None of the analysts claim inevitability; each view anchors risk at visible levels. For spot traders, the rising lower boundary around $0.24 is the line that converts a healthy uptrend into distribution if lost; for relative-value traders, the 7-month average near 0.00000187 BTC plays the same role. As long as those floors hold, the evidence presented by IncomeSharks, Cantonese Cat, and Degentrading says it is not “too late,” but rather still about execution around the channel midline and the MA reclaim that would validate the next leg.
At press time, DOGE traded at $0.248.


You May Also Like

The changing face of elder care in Malaysia — Sayed Mohammad Reza Yamani Sayed Umar

GOP lawmakers want nothing to do with Trump's ballroom chaos: report

Not a loophole: Singapore AI export controls let China tap US AI legally


