Solana price is languishing at a technical bear market after plunging by over 27% from its highest level in August this year.Solana price is languishing at a technical bear market after plunging by over 27% from its highest level in August this year.

Here’s why Solana price plummeted as SOL ETFs crossed $500m milestone

2025/11/01 23:30
3 min read
For feedback or concerns regarding this content, please contact us at crypto.news@mexc.com

Solana price is languishing at a technical bear market after plunging by over 27% from its highest level in August this year.  

Summary
  • Solana price has plunged into a bear market after falling by 27% from the year-to-date high.
  • Spot SOL ETFs crossed the important $500 million milestone on Friday.
  • They have had cumulative inflows of almost $200 million. 

Solana price drops despite ETF launches

Solana (SOL) token was trading at $185 today, Nov. 1, much lower than the year-to-date high of nearly $300. 

SOL token remains in a bear market, even after the Securities and Exchange Commission gave its go-ahead for the spot Solana ETFs this week.

These funds have received a warm welcome from American investors who see cryptocurrencies as viable alternative assets. Data compiled by SoSoValue shows that these funds have had inflows worth about $200 million. 

Their total assets have also crossed the $500 million milestone, which is equivalent to 0.50% of the token’s market capitalization. 

Bitwise’s BSOL ETF is leading the way with $400 million in total assets because of its first-mover advantage and its lower fees. It has an expense ratio of 0.20%, lower than Grayscale’s 0.35%. Grayscale offsets this fee by offering staking solutions, allowing investors to earn up to a 7.5% yield.

There are two possible reasons why the Solana price has dropped after the ETF launches. First, the launches happened in a difficult week for the market when most tokens plunged. 

Bitcoin (BTC) dropped to $108,000 while the market cap of all tokens fell to $3.7 trillion. It is common for even the strongest tokens to plunge when there is a broader sell-off.

The other possible reason is that traders are selling the news. This is a situation where crypto assets plunge ahead of a major event and then drop when it happens. 

Looking ahead, the possible catalysts for Solana will be the upcoming approval of more ETFs and the Alpenglow upgrade that will boost its performance. 

SOL price technical analysis 

Solana price

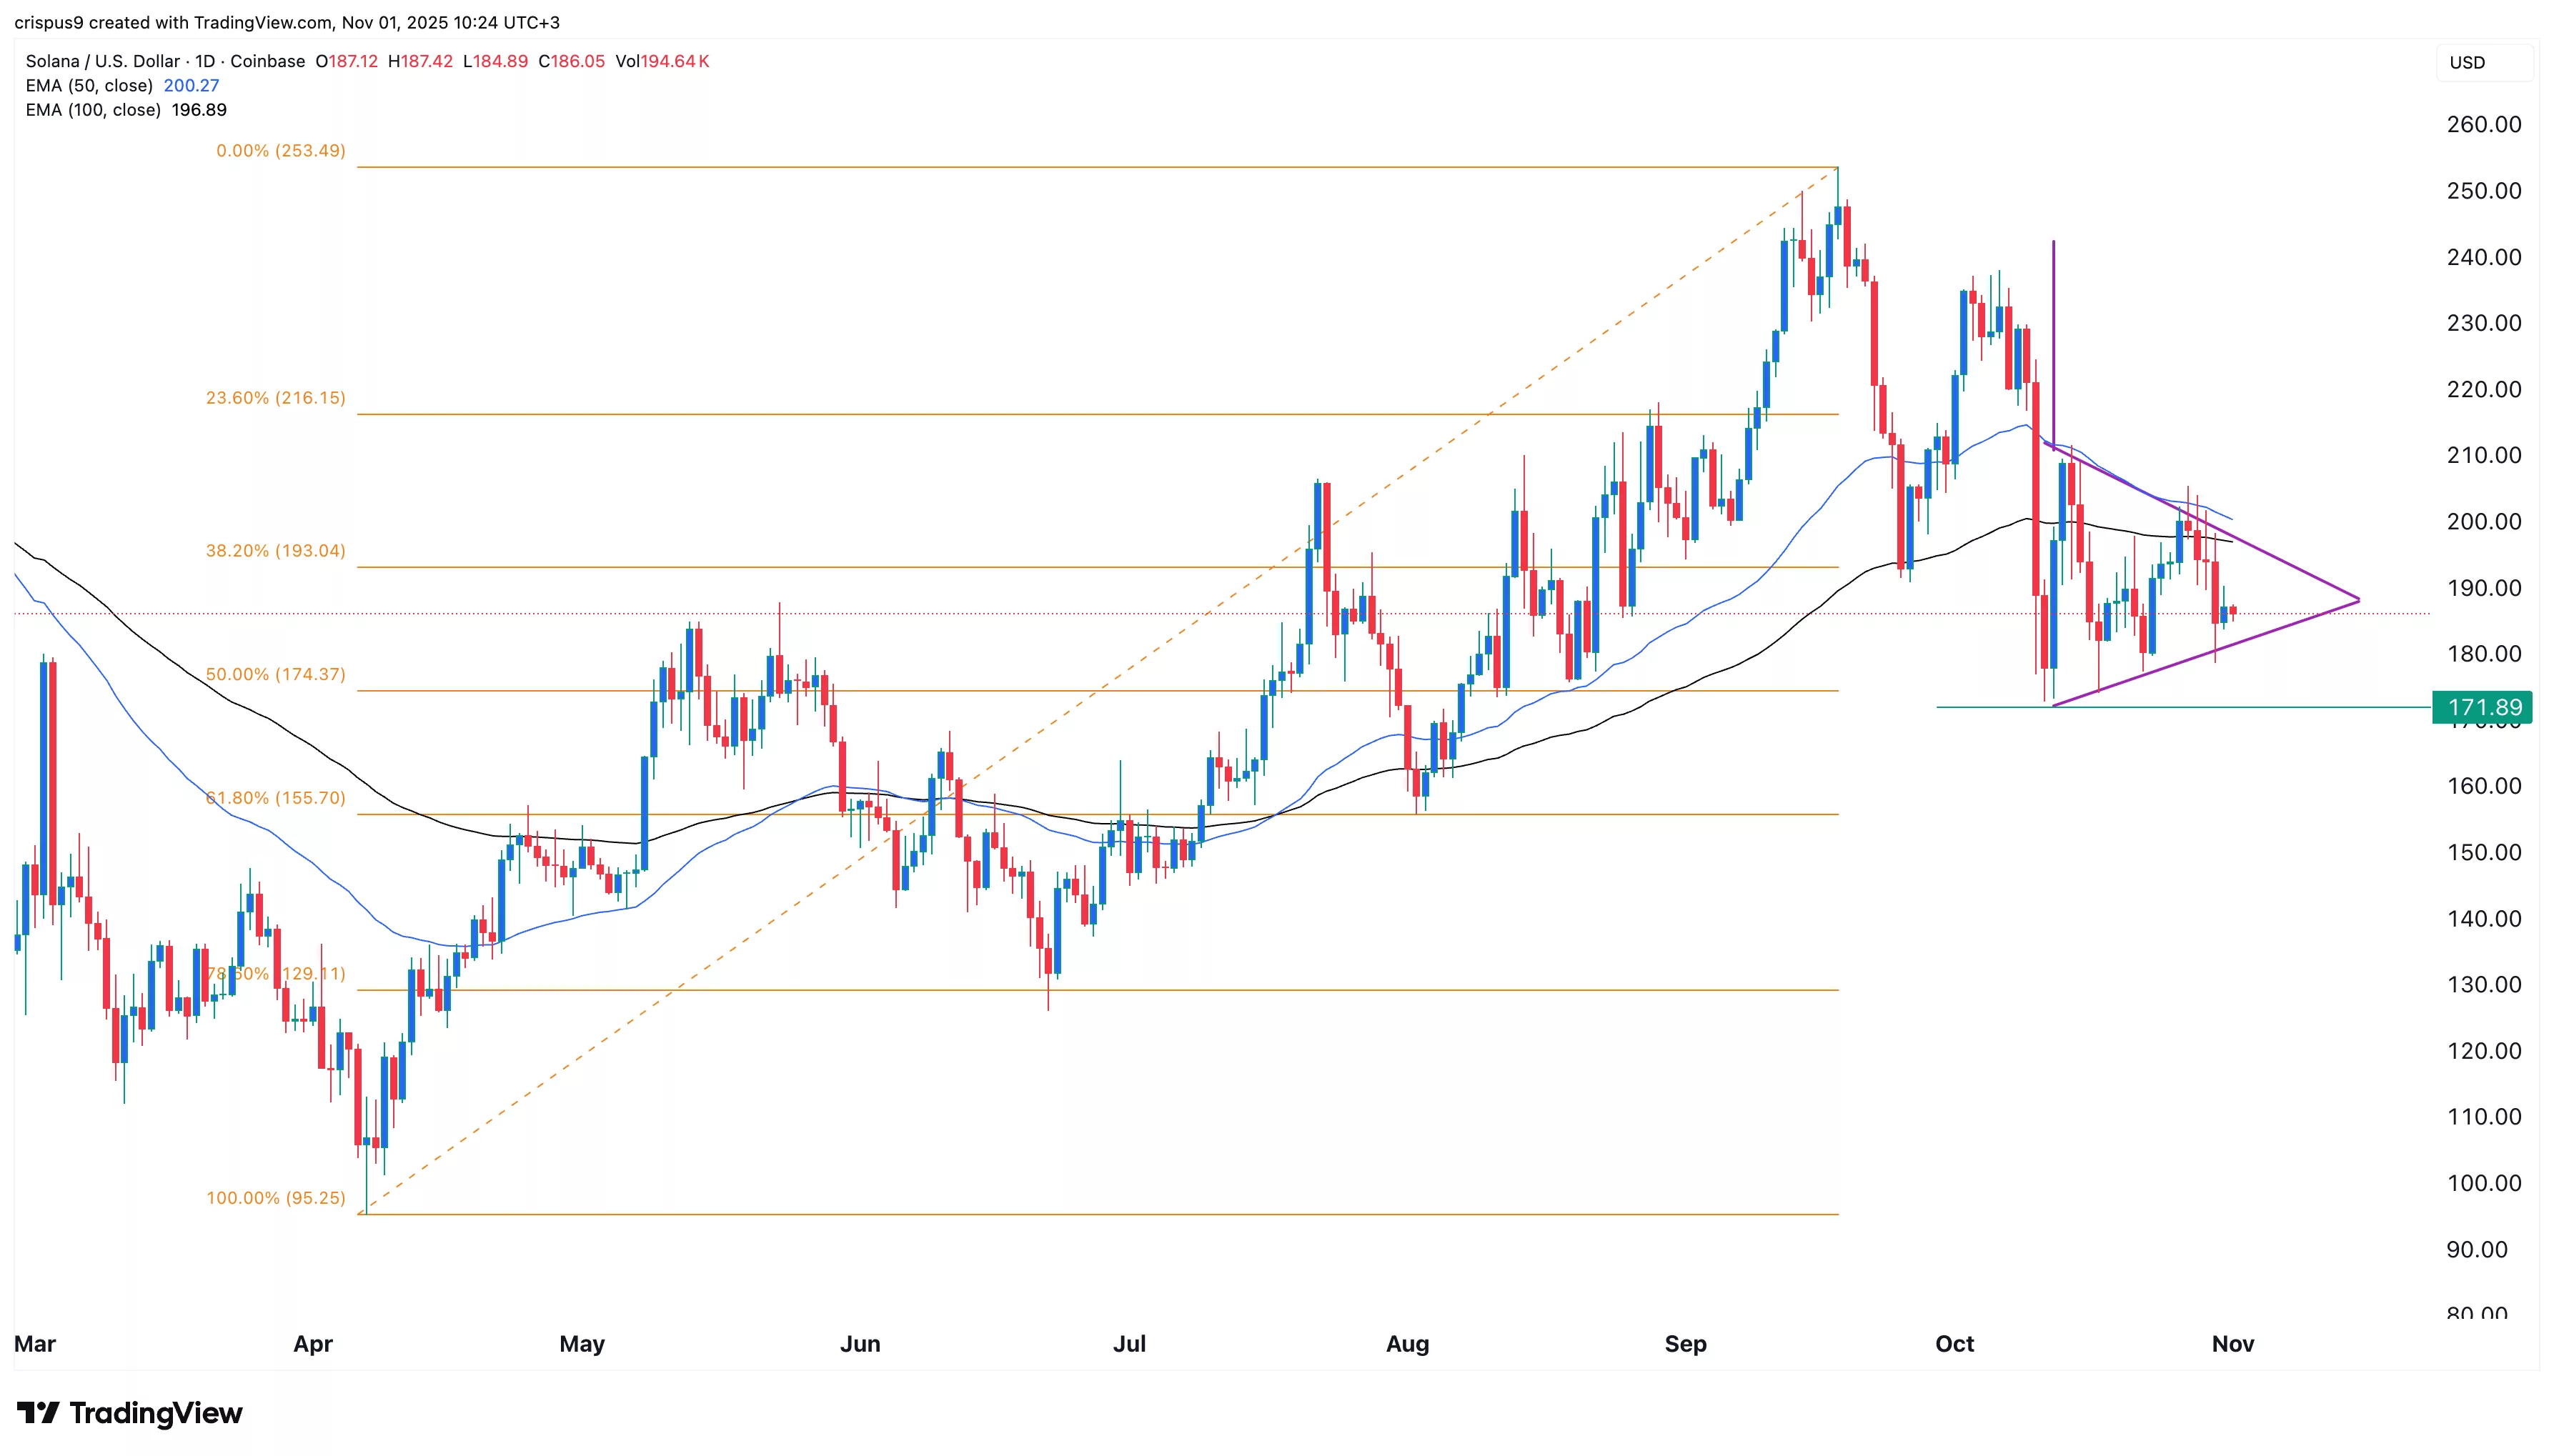
The daily chart shows that the Solana price has dropped in the past few months. It has now moved below the 38.2% Fibonacci Retracement level.

SOL price also moved below the 50-day and 100-day Exponential Moving Averages. Most notably, it is in the process of completing the formation of the bearish pennant pattern. It is also lower than the Supertrend indicator. 

Therefore, the token will likely continue falling as sellers target the next key support level at $171, the lowest level on Oct. 11, and the 50% retracement level. A drop below that level will point to more downside, potentially to $150.

Market Opportunity
Solana Logo
Solana Price(SOL)
$88.43
$88.43$88.43
+1.93%
USD
Solana (SOL) Live Price Chart
Disclaimer: The articles reposted on this site are sourced from public platforms and are provided for informational purposes only. They do not necessarily reflect the views of MEXC. All rights remain with the original authors. If you believe any content infringes on third-party rights, please contact crypto.news@mexc.com for removal. MEXC makes no guarantees regarding the accuracy, completeness, or timeliness of the content and is not responsible for any actions taken based on the information provided. The content does not constitute financial, legal, or other professional advice, nor should it be considered a recommendation or endorsement by MEXC.

You May Also Like

Bitcoin Could Surge to $95,894, Analyst Makes Bold Prediction

Bitcoin Could Surge to $95,894, Analyst Makes Bold Prediction

The post Bitcoin Could Surge to $95,894, Analyst Makes Bold Prediction appeared on BitcoinEthereumNews.com. Bitcoin at $95,000, how soon? Bitcoin slips back to $
Share
BitcoinEthereumNews2026/03/15 12:30
Egrag Crypto: XRP Could be Around $6 or $7 by Mid-November Based on this Analysis

Egrag Crypto: XRP Could be Around $6 or $7 by Mid-November Based on this Analysis

Egrag Crypto forecasts XRP reaching $6 to $7 by November. Fractal pattern analysis suggests a significant XRP price surge soon. XRP poised for potential growth based on historical price patterns. The cryptocurrency community is abuzz after renowned analyst Egrag Crypto shared an analysis suggesting that XRP could reach $6 to $7 by mid-November. This prediction is based on the study of a fractal pattern observed in XRP’s past price movements, which the analyst believes is likely to repeat itself in the coming months. According to Egrag Crypto, the analysis hinges on fractal patterns, which are used in technical analysis to identify recurring market behavior. Using the past price charts of XRP, the expert has found a certain fractal that looks similar to the existing market structure. The trend indicates that XRP will soon experience a great increase in price, and the asset will probably reach the $6 or $7 range in mid-November. The chart shared by Egrag Crypto points to a rising trend line with several Fibonacci levels pointing to key support and resistance zones. This technical structure, along with the fractal pattern, is the foundation of the price forecast. As XRP continues to follow the predicted trajectory, the analyst sees a strong possibility of it reaching new highs, especially if the fractal behaves as expected. Also Read: Why XRP Price Remains Stagnant Despite Fed Rate Cut #XRP – A Potential Similar Set-Up! I've been analyzing the yellow fractal from a previous setup and trying to fit it into various formations. Based on the fractal formation analysis, it suggests that by mid-November, #XRP could be around $6 to $7! Fractals can indeed be… pic.twitter.com/HmIlK77Lrr — EGRAG CRYPTO (@egragcrypto) September 18, 2025 Fractal Analysis: The Key to XRP’s Potential Surge Fractals are a popular tool for market analysis, as they can reveal trends and potential price movements by identifying patterns in historical data. Egrag Crypto’s focus on a yellow fractal pattern in XRP’s price charts is central to the current forecast. Having contrasted the market scenario at the current period and how it was at an earlier time, the analyst has indicated that XRP might revert to the same price scenario that occurred at a later cycle in the past. Egrag Crypto’s forecast of $6 to $7 is based not just on the fractal pattern but also on broader market trends and technical indicators. The Fibonacci retracements and extensions will also give more insight into the price levels that are likely to be experienced in the coming few weeks. With mid-November in sight, XRP investors and traders will be keeping a close eye on the market to see if Egrag Crypto’s analysis is true. If the price targets are reached, XRP could experience one of its most significant rallies in recent history. Also Read: Top Investor Issues Advance Warning to XRP Holders – Beware of this Risk The post Egrag Crypto: XRP Could be Around $6 or $7 by Mid-November Based on this Analysis appeared first on 36Crypto.
Share
Coinstats2025/09/18 18:36
Scallop completed the full formal verification performed by Asymptotic.

Scallop completed the full formal verification performed by Asymptotic.

PANews reported on March 15th that Scallop Lend has completed a comprehensive formal verification conducted by Asymptotic (Mysten Labs' official audit partner).
Share
PANews2026/03/15 11:49