SPX6900 Price Tumbles 14% as SPX Risks Further Losses as Momentum Shifts Bearish

Highlights:
- The SPX6900 price has slipped 14% in the past 24 hours to $0.77, as the crypto market tumbles.
- Coinglass data shows a drop in SPX open interest, indicating a drop in investor activity.
- The technical outlook shows a death cross in the market, which may see the SPX6900 price drop further to $0.65.
The SPX6900 price has tumbled 14% to $0.77, as the crypto market loses optimism. Despite the fall, the daily trading volume has spiked 15% to $28M, indicating growing market confidence. Meanwhile, the derivatives market data shows a bearish outlook, as the open interest plunges. Further, the SPX technical outlook shows a ‘’death cross’’ indicating a bearish picture. However, with the strong volume, can the bulls rebuild momentum?
According to the Open Interest of Coinglass in the futures of the SPX meme coin, there have been noticeable declines. The open interest has declined to $9.30 million on Monday, as opposed to the level of $18.96 million on October 7. Such a reduction of OI, which has been declining since July, indicates the decline in investor activity and strengthens a declining market mood towards the SPX6900 price.
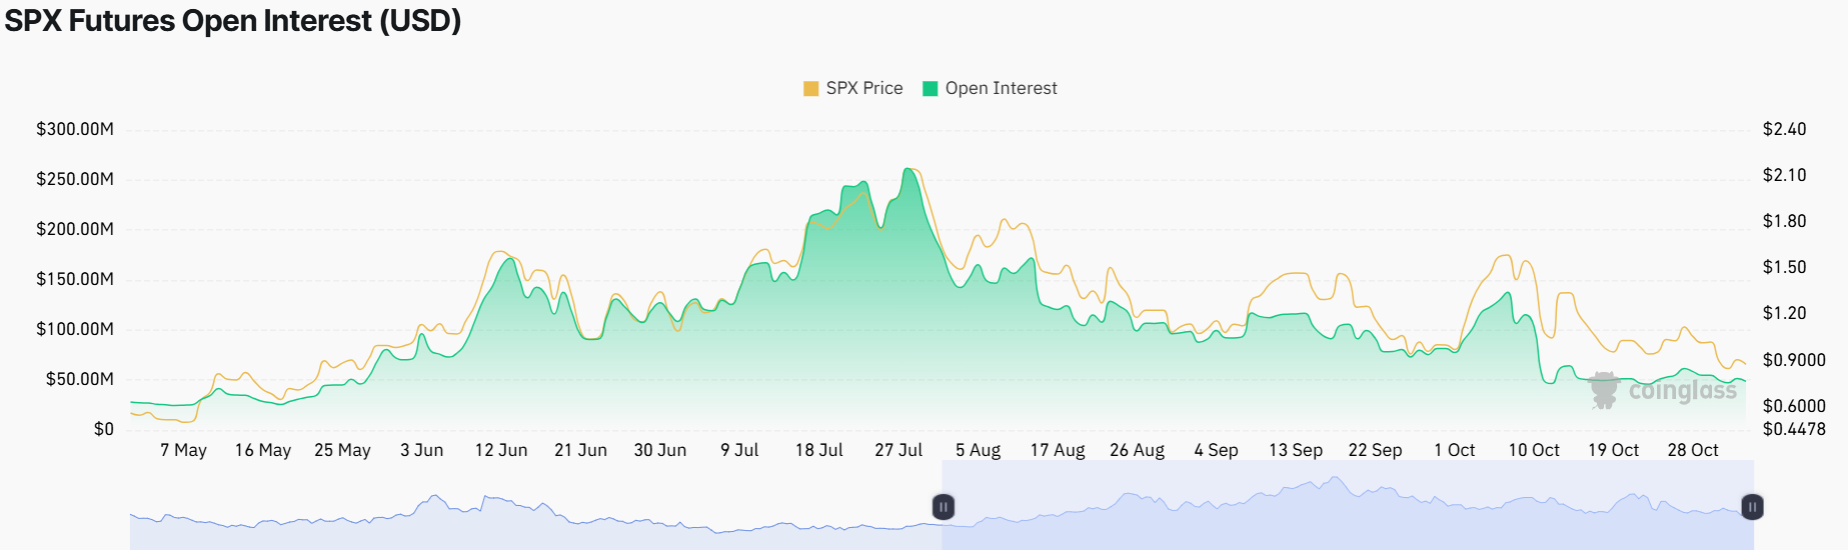 SPX Futures Open Interest: CoinGlass
On the other hand, the SPX6900 derivatives metrics are leaning on the bearish side. On Monday, the outcome of the long to short ratio of SPX at 0.88, the lowest in a month, increased bearish bets among traders at CoinGlass.
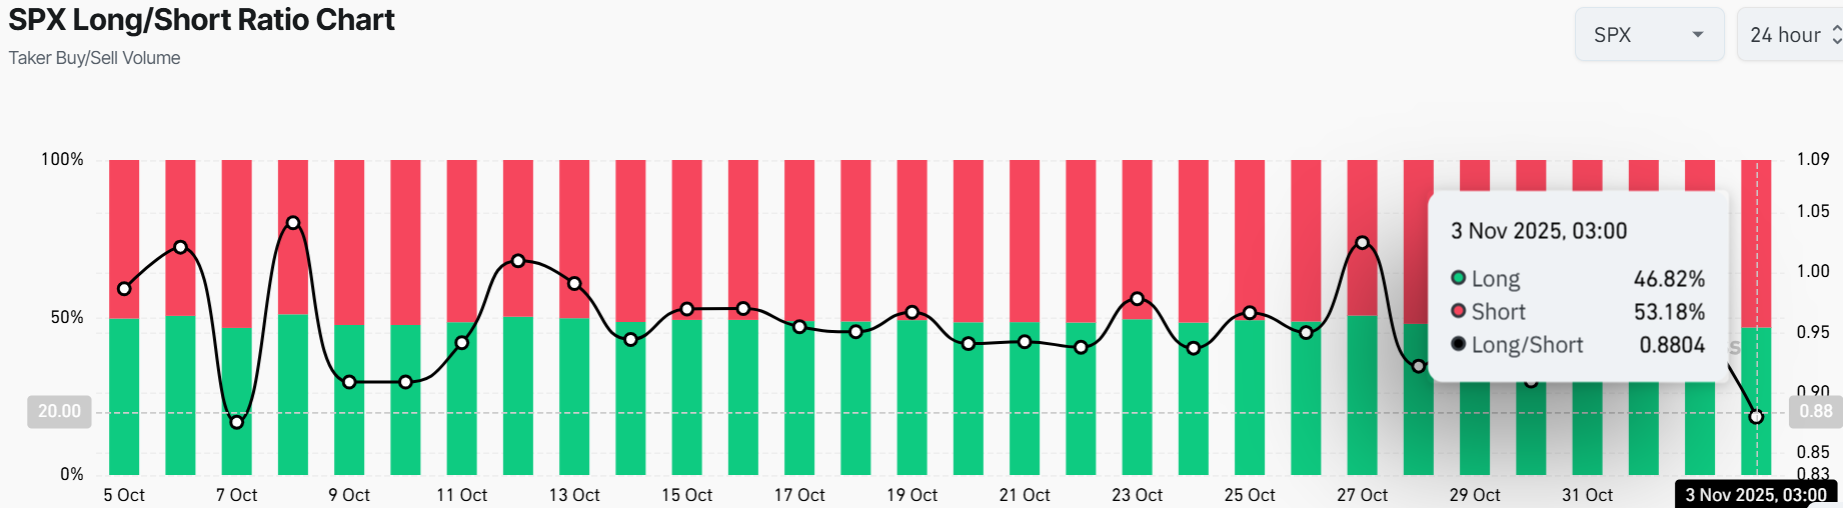 SPX Long/Short Ratio: CoinGlass
SPX6900 Price Drop May Not Be Over Yet
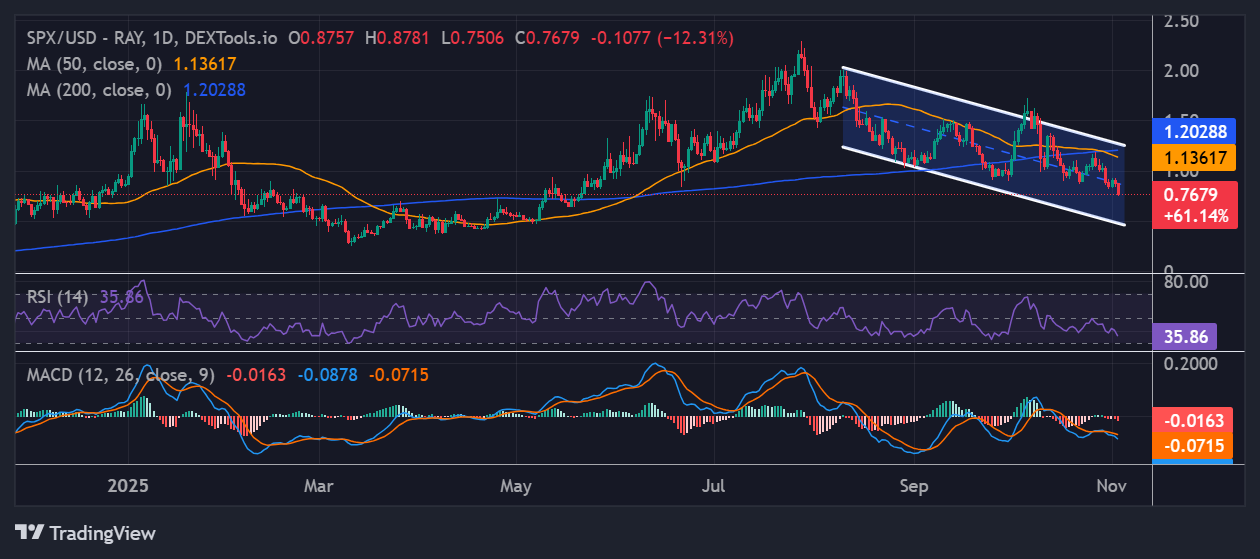
The SPX/USD chart shows the meme coin on a 1-day chart timeframe. Right now, it is hovering around $0.77, with a recent dip of 14% in the last 24 hours. The 50 Simple Moving Average (SMA) sits at $1.13, while the 200 SMA is at $1.20, which indicates SPX is riding a bearish trend. This is because the moving averages are cushioning the bulls against further upside, and the recent death cross reinforces the outlook.
Notably, trouble is brewing as the Relative Strength Index (RSI) is plummeting and currently sits at 35.86, near the 50-neutral zone. The chart also shows a classic descending parallel pattern setup, as the bears continue to suppress the bulls.
 SPX/USD 1-day chart: TradingView
Looking ahead, the 50-SMA is sloping down, the blue 200-SMA is lagging, signaling a potential disconnect as momentum fades. SPX6900’s volume is currently up 15%, which, if it holds strong, the bulls could show some strength in the coming days. The MACD’s orange line dipping below the signal line is also a red flag, showing momentum is shifting, and fast. If SPX6900 price continues the downward trend, reinforced by the negative technical outlook, $0.65 could be a solid support zone.
A worst-case scenario would be a crash toward $0.48 if panic selling sets in. On the flip side, if bulls step in and push past $1.13, SPX6900 price might dodge the bullet and aim for $1.20 resistance level, aligning with the 200-day SMA. In the meantime, the 14% drop is not a lock, but the chart is showing warning signs. Traders should keep an eye on the technical indicators and the volume to determine the next move in the SPX market.
eToro Platform
Best Crypto Exchange
- Over 90 top cryptos to trade
- Regulated by top-tier entities
- User-friendly trading app
- 30+ million users
eToro is a multi-asset investment platform. The value of your investments may go up or down. Your capital is at risk. Don’t invest unless you’re prepared to lose all the money you invest. This is a high-risk investment, and you should not expect to be protected if something goes wrong.


You May Also Like

Shiba Inu Price Prediction Weakens as AI Token Sector Surges 30% to $19B While Pepeto SHIB and TAO Take Different Paths

Regulator presses airlines to use sustainable fuel