China’s investment dropped over 11% in October, marking its worst monthly fall since early 2020
The investment engine inside China just swung hard in reverse, and people in markets are trying to figure out who pulled the lever, where it happened inside the system, when the slide really started, why the decline hit so sharply, and which officials supplied the data that confirmed the collapse.
Official numbers released on Friday showed that investment in China dropped more than 11% in October from a year earlier, the worst single‑month fall since the early Covid shutdowns in 2020.
Economists said the hit was alarming because investment makes up almost half of China’s GDP, and this slump landed while the country was already dealing with weak exports.
The scale of the setback stunned analysts because the dive in fixed‑asset investment began in July, but it still did not show the kind of damage one would expect in broader growth data.
Gross capital formation, a different investment measure, actually added almost a fifth of the third‑quarter GDP growth.
That mismatch pushed economists into a scramble to understand why one part of China’s investment machine was falling apart while another part was still adding power.
Analysts question the data as the slump deepens
Ding Shuang at Standard Chartered said the drop in investment was hard to explain because the scale of the fall did not line up with other indicators. He said the drag from investment would be even heavier in the fourth quarter and would likely become the main reason GDP growth slows.
The timing raised eyebrows because the downturn started around the launch of the government’s “anti‑involution” campaign, which was aimed at reducing excess output in several industries.
Officials never gave targets for cutting investment or capacity, making it impossible to know how much of the slump came from the policy itself.
Economists warned that reducing industrial investment without offering stimulus could weigh on jobs and income.
They said weak domestic demand remained a problem because the country has struggled to shift from investment‑driven growth to consumption‑driven growth, especially while the property market stayed in crisis.
Calculations based on National Bureau of Statistics data showed fixed‑asset investment falling 6% to 7% across the third quarter, but the NBS only releases year‑to‑date totals.
The bureau said falling prices dragged down the FAI numbers while gross capital formation reflected adjusted real growth. It also said the two measures count different things, including land fees and used equipment inside FAI.
Adam Wolfe at Absolute Strategy Research said the fall in FAI was too sharp and too broad to blame on those differences alone. He pointed out that other parts of China’s economy did not show the same kind of distress.
Industrial output grew 6.1% in the year to date, and retail sales climbed around 4%. Economists also said it had become harder to judge the real condition of the economy because several official and private data series were halted in recent years.
Some analysts said FAI was an old Soviet‑style measure that had long faced problems like double‑counting, though reports from the Peterson Institute said recent reforms had narrowed the gap between the two investment measures.
Industry breakdown exposes sharper weakness
Analysts at Gavekal Dragonomics said corporate investment likely slowed for a long time, and the recent drop in FAI might be more about changes in reporting than an actual collapse in activity.
They said officials across China might under‑report investment to look loyal to the “anti‑involution” push. Other factors were also hurting investment, including worsening conditions in property, falling real estate spending, and slowing infrastructure spending as local governments focused on hidden debt and unpaid bills.
Manufacturing investment took a harder hit, slowing to 2.7% growth in the first 10 months after sitting near 9% in May. Industry‑level data showed big declines in sectors targeted by the campaign, such as electric equipment and machinery, which includes batteries and solar panels.
Investment in that category fell more than 9% this year, with the slide starting in August 2024. But other targeted sectors did not slow. Auto investment jumped almost 18%.
Goldman Sachs economists looked at cement demand implied by FAI and compared it with actual cement output.
They said the gap narrowed recently, which could mean the NBS adjusted data to prevent over‑reporting.
Claim your free seat in an exclusive crypto trading community - limited to 1,000 members.


You May Also Like
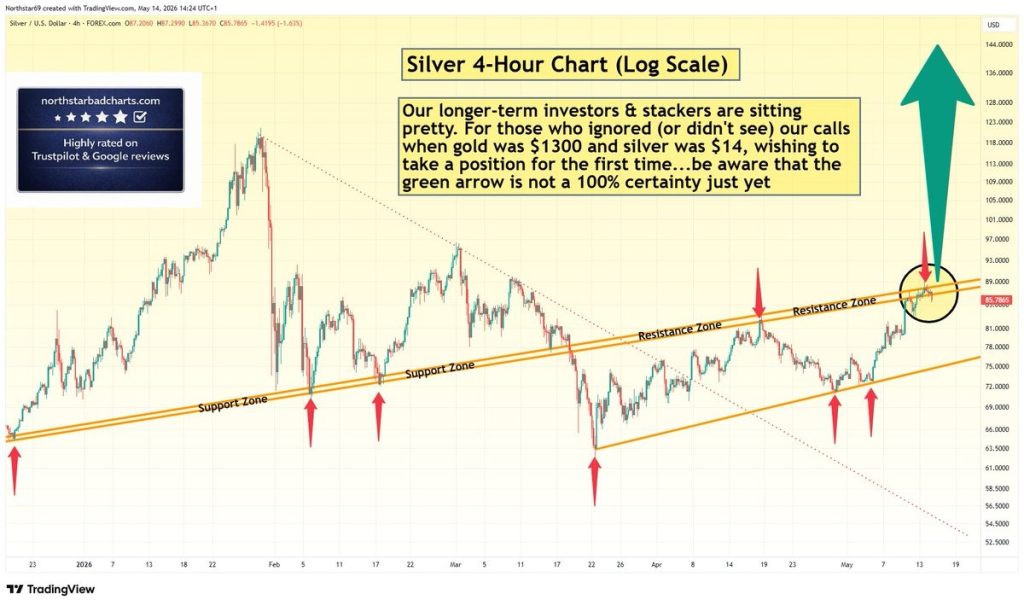
Silver Price Warning: Green Arrow Setup Is Not Confirmed – Wait for Clear Signal

Facebook spotlights African cinema in 6th ‘Made by Africa, loved by the world’ campaign