Bitcoin (BTC) bull market is not over yet: Price analysis
As the selling pressure increases on Bitcoin, pulling it down from the last refuge of the bull market trendline, the consensus on social media is that these are the last rites and that the bear market beckons. Could the consensus be wrong?
Bulls are starting to put up a fight
Source: TradingView
The main point for the bears in the 4-hour time frame is that the $BTC price has continued to descend and has dropped below the bull market trendline. There is no sugar-coating this but ... it does rather look as though the bulls are starting to put up a fight here. The last 4-hour candle was heading down steeply but was then bought up quickly leaving a decent sized candle wick behind.
If the price can hold above the strong support level, the next big face-off between the bulls and the bears will take place. This will either be a rejection or breakout of the descending trendline (faint dotted line). A rejection would mean the price getting further away from the major trendline, while a breakout should also coincide with the breakout of the neckline of a W pattern. This could take the price back to the relative safety of being above the major trendline again.
Breakdown has been confirmed but …
Source: TradingView
Looking at the daily chart for the $BTC price it is quite difficult to whip up some bearish sentiment. Yes, the price has fallen below the major trendline, and yes, at least for this time frame, the breakdown has been confirmed. Nevertheless, going back along this trendline, there has been a previous case where two candle bodies closed below, but the next candle body shot back above and the bull market continued. Could this happen again here?
The Stochastic RSI indicators are very near the bottom, as they are on most time frames. Even if there is a further fall from here, it would be unlikely to descend too much further, given that upside price momentum is potentially only just around the corner.
A quick tweak of the bull market trendline and Hey Presto!
Source: TradingView
Moving the major bull market trendline? Is this cheating just to make a particular scenario work? Ok, when drawing a trendline, you aim to take the trendline through as many touchpoints as possible. If you look at the original trendline (faint dotted line) including the beginning of the trendline, there are 4 touchpoints. The redrawn trendline also has 4 touchpoints, although the big red candle wick down at the end of July 2024 could probably also be included, making it 5.
Some will then say, “what about the green candle wick down at the end of March 2025?”. This does not touch the newly drawn trendline. While it would be a more complete trendline if it did so, in the grand scheme of things it doesn’t have to.
The main thing to consider is that they are both valid trendlines. The original one is more valid on the weekly time frame, while the newly drawn one looks slightly better in the 2-week time frame.
One more thing to bear in mind, especially from a bullish perspective, is the descent of the Stochastic RSI indicators in this time frame. The weekly indicators are already at the bottom. With the 2-week indicators to bottom soon, this could portend the next big upside wave.
Still clinging to hope? You bet!
Disclaimer: This article is provided for informational purposes only. It is not offered or intended to be used as legal, tax, investment, financial, or other advice.


You May Also Like
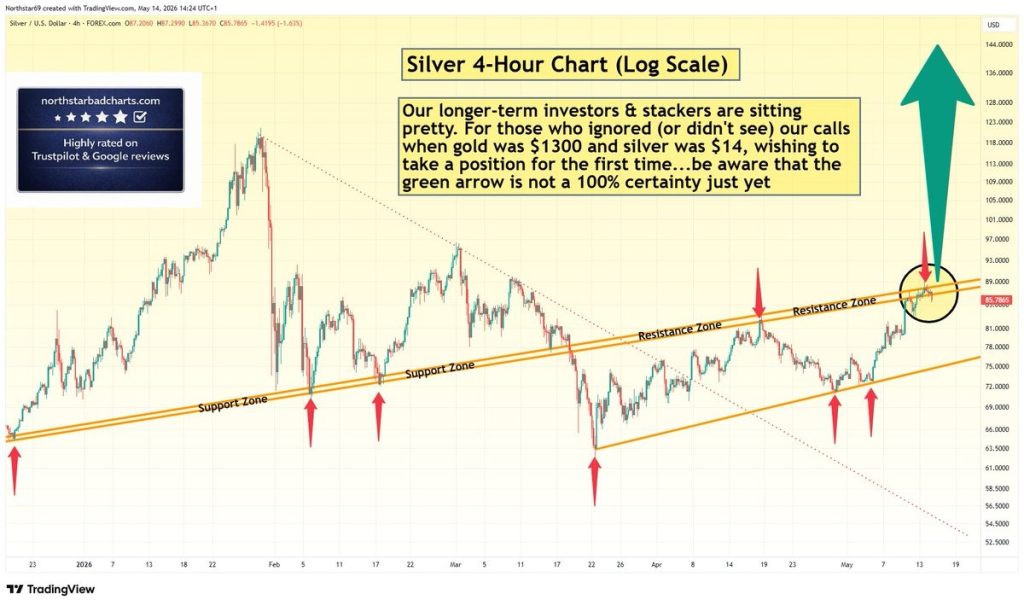
Silver Price Warning: Green Arrow Setup Is Not Confirmed – Wait for Clear Signal

Facebook spotlights African cinema in 6th ‘Made by Africa, loved by the world’ campaign