Solana SOL price today: bears test key support as traders eye a bounce
 For traders tracking Solana SOL price today, the token is sitting at a delicate junction between a pressured higher timeframe and a more constructive intraday tone. In the following analysis we will unpack how daily and intraday indicators line up, and what that alignment could mean for the next directional move.
 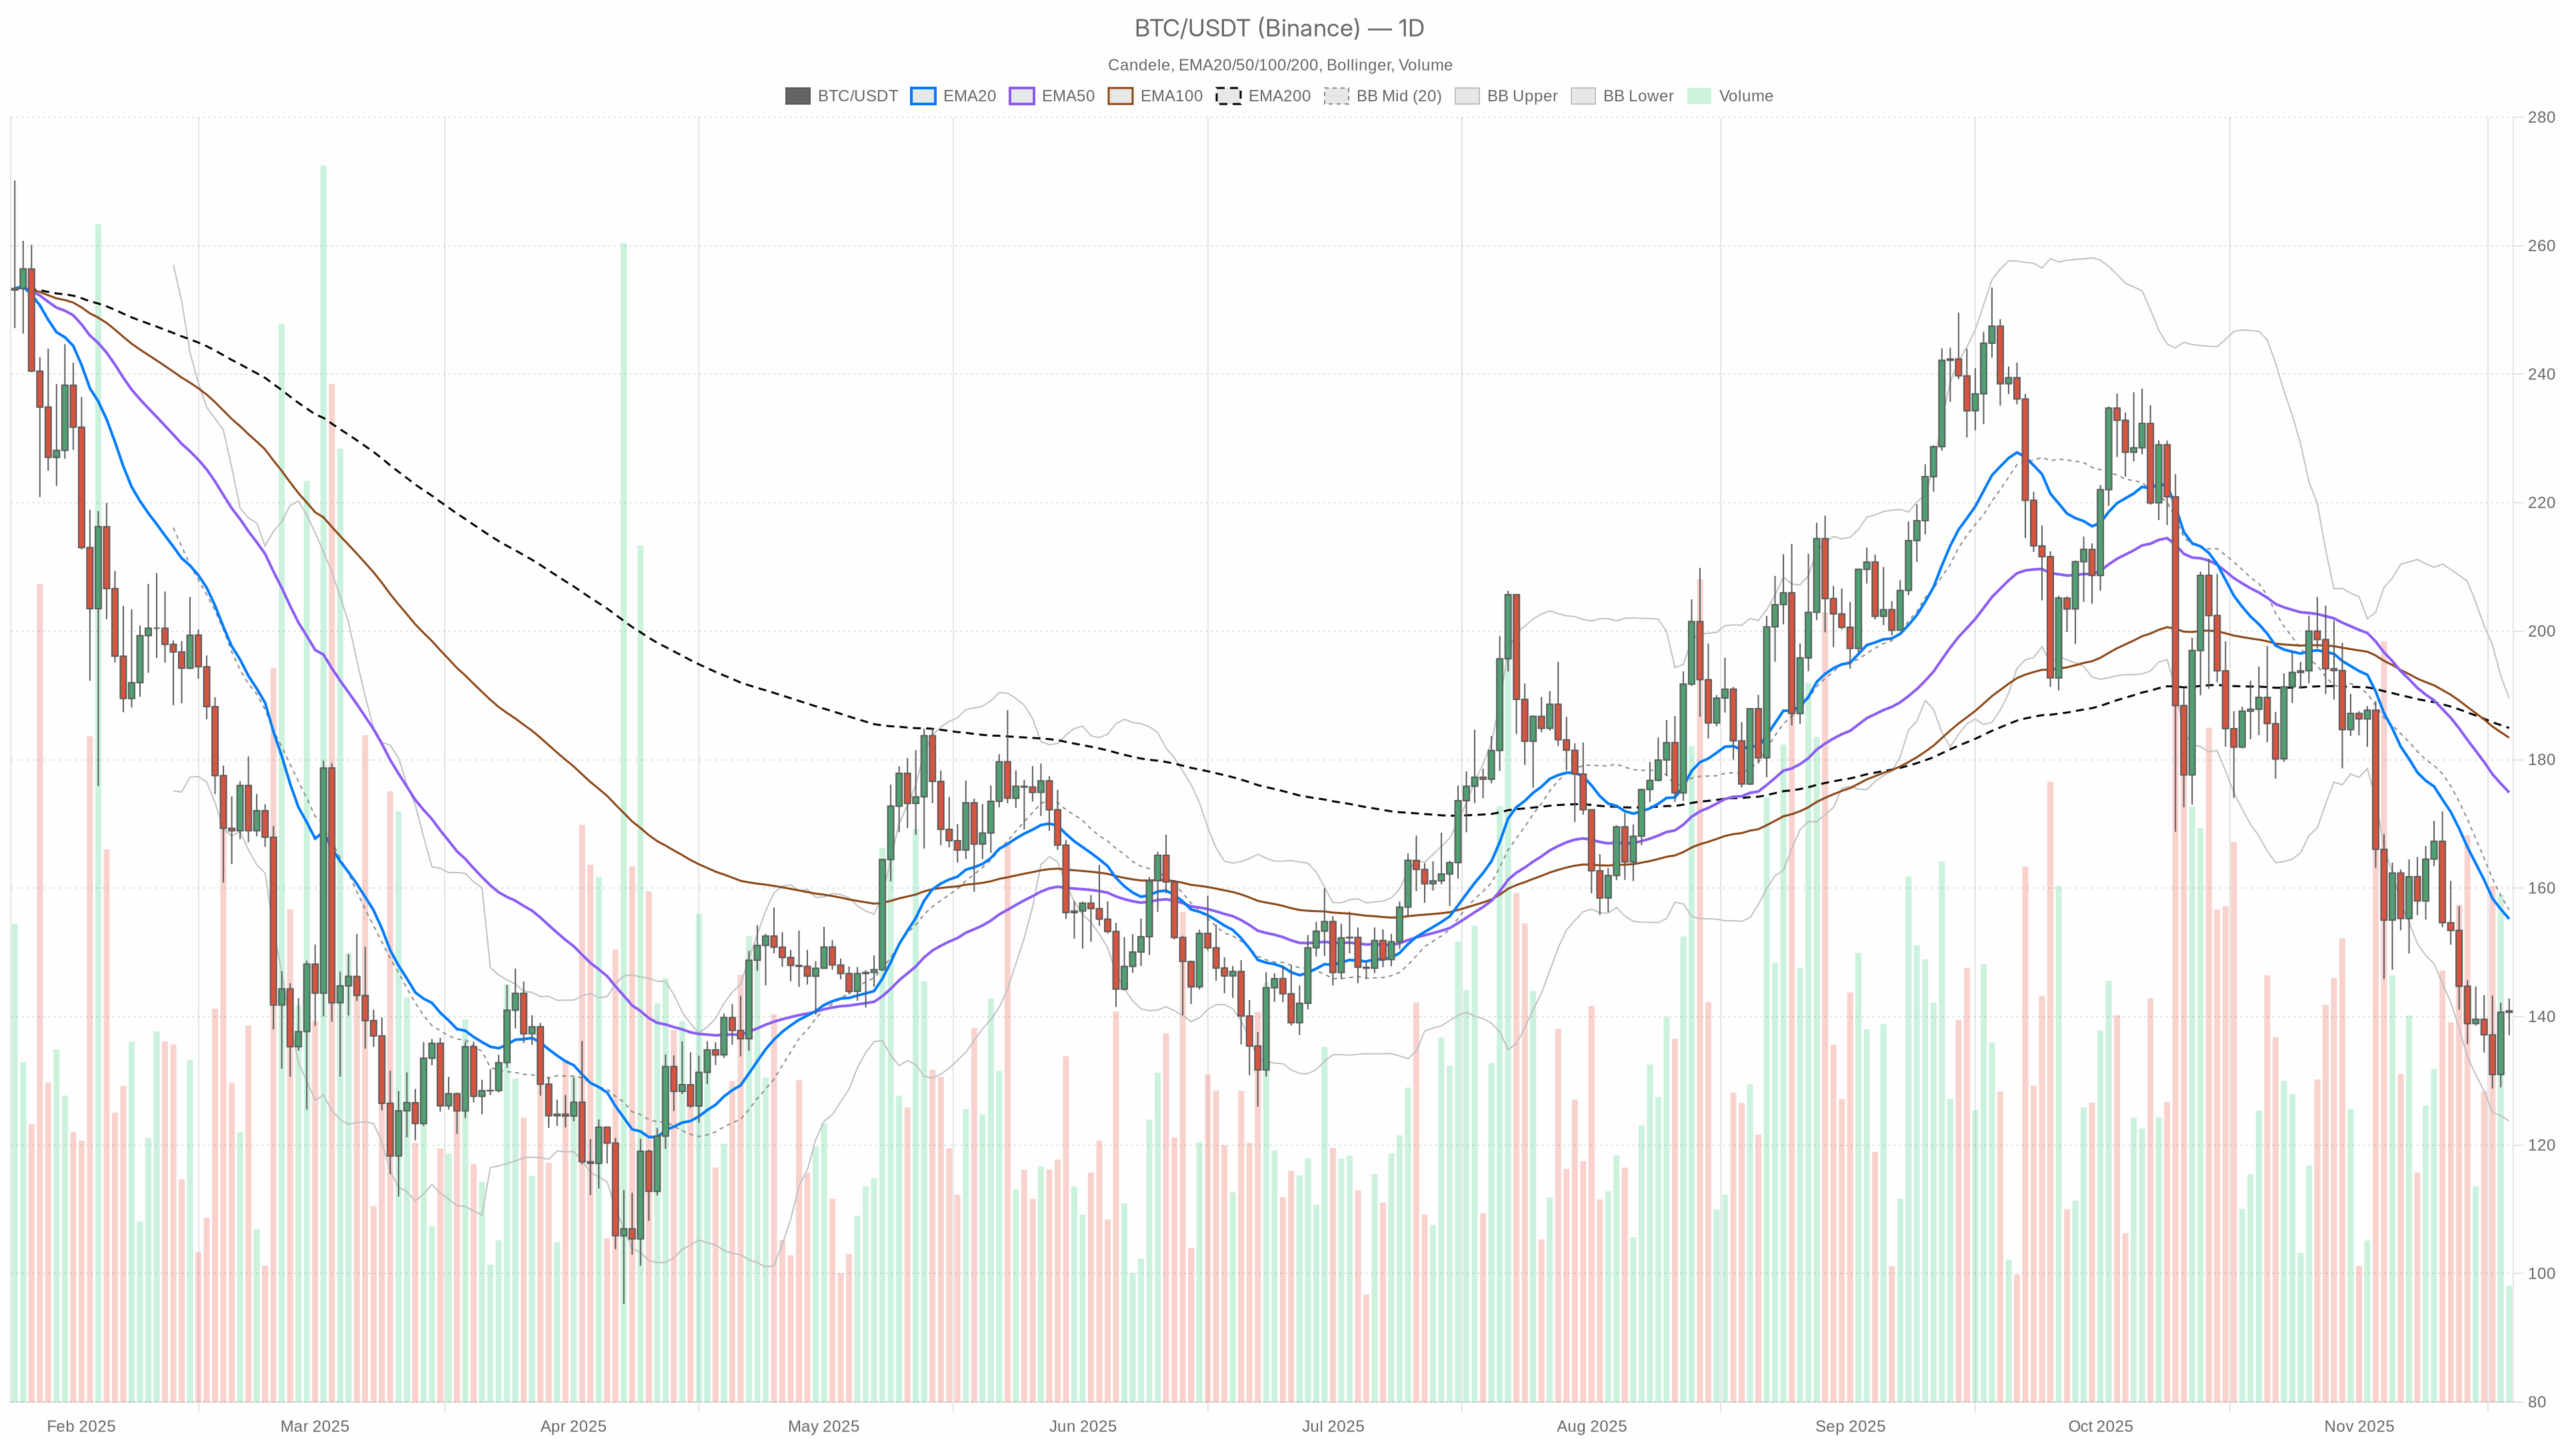 SOL/USDT — daily chart with candlesticks, EMA20/EMA50 and volume.
Summary
The asset trades around 140.9 USDT on the daily chart, below the 20, 50 and 200-day exponential moving averages, confirming a dominant bearish regime. RSI on the daily timeframe sits near 36, signaling weak momentum but not yet a fully washed-out capitulation. Moreover, MACD remains below its signal line with a modest negative histogram, hinting at downside momentum that is losing some intensity. Volatility, as captured by ATR around 11, is moderate, suggesting room for swings without outright chaos. Meanwhile, the broader crypto market is growing, with total capitalization above 3.23 trillion dollars and bitcoin dominance near 56.7%, which keeps altcoins somewhat in its shadow. Sentiment is locked in “Extreme Fear” on the Fear & Greed Index at 15, so positioning appears cautious and reactive, not euphoric.
Solana SOL price today: Market Context and Direction
The wider backdrop is essential to understanding this token’s latest moves. The global crypto market cap is about 3.23 trillion dollars, up roughly 1.5% over the last 24 hours, which points to a still resilient risk environment. However, bitcoin commands around 56.7% of total capitalization, illustrating a market regime where capital prefers perceived safety over speculative alt exposure. In such phases, large caps like this one can lag unless they deliver a strong idiosyncratic catalyst.
At the same time, the Fear & Greed Index at 15 shows extreme fear, indicating that many traders are positioned defensively, or waiting on the sidelines. That said, these environments can also precede powerful reversals if bad news is already priced in. As a result, the present setup looks like a tug-of-war between structural caution and the potential for relief rallies.
Technical Outlook: reading the overall setup
On the daily timeframe, price at 140.9 USDT sits well below the 20-day EMA at 155.22, the 50-day at 174.9, and the 200-day at 184.95. This alignment of moving averages above price indicates clear downside trend confirmation on the higher timeframe, with sellers still in control of the bigger picture. The fact that all three reference EMAs are stacked above each other suggests that any bounce will initially be treated as a rally into resistance.
RSI14 at 36 reinforces this view. It signals a bearish bias, but not yet extreme oversold territory. In practice, this means the market is weak, yet it still has some room to the downside before hitting the kind of momentum exhaustion that often accompanies strong reversals. If RSI were to dip closer to 30 while price tests or undercuts the lower Bollinger Band, that could mark a better area for contrarian buyers.
MACD provides a similar story. The MACD line at -13.67 hovers below its signal line at -12.92, with a small negative histogram of -0.75. This reflects waning bearish momentum rather than fresh aggressive selling. Bears are still in charge, but the selling pressure appears less one-sided than earlier in the down move, raising the odds of choppy consolidation or a countertrend bounce.
Bollinger Bands on the daily chart show the mid-band around 156.64, the upper band near 189.54, and the lower band at roughly 123.73. With price presently between the mid and lower bands, the asset is in the lower half of its recent volatility envelope. This positioning highlights a downward bias within a contained volatility channel, where sharp squeezes higher are possible if sellers become complacent.
ATR14 near 11.01 indicates moderate daily volatility. Swings of about 7–8% around current price are not unusual in this environment, so traders should size positions with that in mind. Moreover, the daily pivot at 140.29, with nearby support around 137.73 and resistance near 143.45, frames a tight intraday battlefield. A sustained move above this cluster would signal a short-term breakout attempt against the prevailing downtrend, while failure here leaves the door open to a retest of the lower Bollinger region.
Intraday Perspective and SOLUSDT token Momentum
Meanwhile, shorter timeframes paint a more balanced, even slightly constructive, picture. On the hourly chart, price trades around 140.94, a bit above the 20-EMA at 139.5 and the 50-EMA at 138.75, yet still below the 200-EMA at 144.22. This combination hints at developing intraday strength inside a broader bearish structure. Short-term bulls have the upper hand, but the larger trend line is still pointing down.
The hourly RSI at 56.35 shows modest positive momentum, suggesting dip-buying interest during the session. MACD on H1, at 0.66 with a signal at 0.91 and a slightly negative histogram, indicates that this intraday push is not especially strong, and may be pausing. As a result, the lower timeframes favor cautious upside probes rather than an explosive reversal.
On the 15-minute chart, price hovers near 140.93, marginally above the 20-EMA at 139.56 and roughly in line with the 50-EMA at 139.76, with the 200-EMA further below at 138.68. RSI at 60.52 reflects short-term bullish momentum, while MACD shows a small positive histogram, backing up the idea of buyers testing the waters. This intraday alignment suggests that scalpers may be leaning long, looking to exploit bounces within the dominant daily downtrend.
Key Levels and Market Reactions
In the near term, the daily pivot region around 140–141 USDT acts as the main battleground. A push above the nearby resistance zone around 143–144, which also aligns with hourly resistance, could invite follow-through toward the mid Bollinger band near 156 and later toward the 20-day EMA. However, bears will likely defend these areas aggressively, as such rallies would still be countertrend within a larger bearish configuration.
On the downside, support is seen just below spot prices around 137–138 USDT. A decisive break under this pocket would expose the wider lower-band region near 124, where volatility could expand and force capitulation-style moves before value buyers step back in. Traders should watch how price behaves on tests of these zones: strong rejections with higher lows would point to emerging accumulation, while clean breaks on high volume would confirm continuing distribution.
Scenarios and Investment Outlook for Solana (SOL) price today
Overall, Solana SOL price today sits at the intersection of a clearly bearish daily trend and a mildly optimistic intraday structure. Swing traders may view current bounces as opportunities to fade rallies into the 150–160 area, where multiple moving averages and the Bollinger midline converge. In contrast, short-term traders might attempt tactical longs while hourly momentum remains constructive, tightly managing risk around the 137–138 support pocket.
For longer-term investors, the current setup suggests patience. Waiting either for a convincing reclaim of the 20 and 50-day EMAs, or for a deeper test closer to the lower Bollinger Band with stronger momentum exhaustion signals, could offer more attractive entries. Until then, disciplined risk management and scenario planning remain essential as the market navigates this phase of fear-driven caution.
This analysis is for informational purposes only and does not constitute financial advice.
Readers should conduct their own research before making investment decisions.


You May Also Like

Hard luck lands J-6er before tough Trump judge

Dartmouth Endowment Adopts Solana ETF, Reaches $14M Crypto Exposure