Solana (SOL) Aims Recovery Run, $155 Resistance Now Back in Focus
Solana started a recovery wave above the $132 zone. SOL price is now consolidating and faces hurdles near the $145 zone.
- SOL price started a decent recovery wave above $135 and $140 against the US Dollar.
- The price is now trading above $140 and the 100-hourly simple moving average.
- There was a break above a key bearish trend line with resistance at $140 on the hourly chart of the SOL/USD pair (data source from Kraken).
- The price could continue to move up if it clears $145 and $150.
Solana Price Aims Higher Levels
Solana price remained stable and started a decent recovery wave above $130, beating Bitcoin and Ethereum. SOL was able to climb above the $135 level.
There was a move above the 23.6% Fib retracement level of the downward move from the $172 swing high to the $129 low. Besides, there was a break above a key bearish trend line with resistance at $140 on the hourly chart of the SOL/USD pair.
Solana is now trading above $140 and the 100-hourly simple moving average. On the upside, immediate resistance is near the $145 level. The next major resistance is near the $150 level.
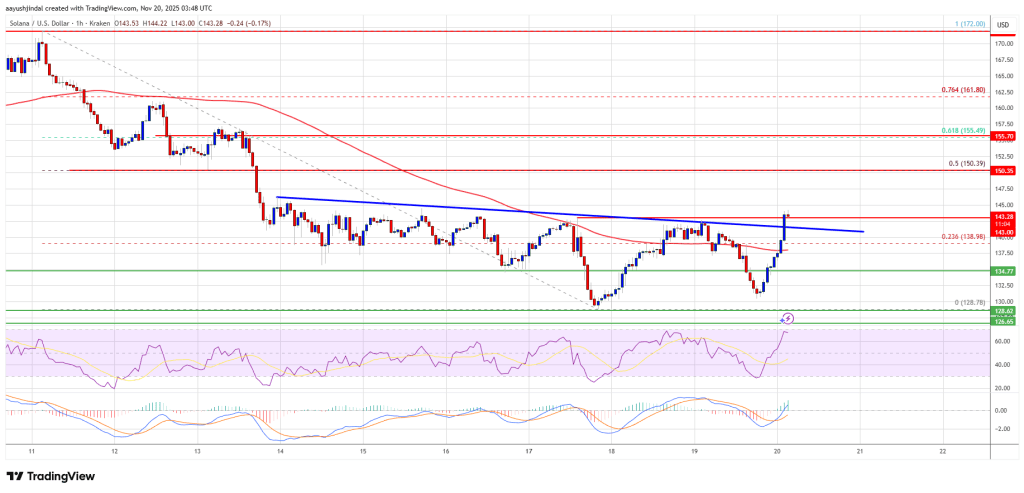
The main resistance could be $155 and the 61.8% Fib retracement level of the downward move from the $172 swing high to the $129 low. A successful close above the $155 resistance zone could set the pace for another steady increase. The next key resistance is $165. Any more gains might send the price toward the $172 level.
Another Drop In SOL?
If SOL fails to rise above the $150 resistance, it could continue to move down. Initial support on the downside is near the $138 zone. The first major support is near the $135 level.
A break below the $135 level might send the price toward the $128 support zone. If there is a close below the $128 support, the price could decline toward the $120 zone in the near term.
Technical Indicators
Hourly MACD – The MACD for SOL/USD is gaining pace in the bullish zone.
Hourly Hours RSI (Relative Strength Index) – The RSI for SOL/USD is above the 50 level.
Major Support Levels – $138 and $135.
Major Resistance Levels – $150 and $155.


You May Also Like

Tron Founder Justin Sun Demoted? Here’s What We Know

Plume and FalconX Bring Institutional Lending On-Chain with RWA Credit Product