

Solana (SOL) Price: Technical Analysis Shows Key Support Test at $130 Level
TLDR
- Solana is trading near $130 after a volatile week, with the price stabilizing around key support levels between $121-$123
- A death cross is forming between the 50-day and 200-day moving averages, the first since early 2023, which typically signals extended bearish momentum
- SOL remains trapped in a descending channel that began in mid-September, with lower highs reinforcing the downtrend
- The RSI at 33 shows mild bullish divergence as buyers defend the $121-$123 support zone with aggressive dip buying
- Bulls need to reclaim $135-$140 resistance levels to shift momentum, while failure to hold $121 could push SOL toward $107 and $95
Solana is trading near $130 as of November 24, 2025, following a week of intense selling pressure and price volatility. The cryptocurrency has found temporary stability after testing critical support levels multiple times.
The price action comes as a technical pattern called a death cross approaches. This occurs when the 50-day moving average crosses below the 200-day moving average. The last time Solana experienced this pattern was in early 2023.
Solana has been trading within a descending channel since mid-September. Each attempt to break higher has failed at the channel’s midpoint. The pattern of lower highs continues to define the current market structure.
The $121 to $123 price range has emerged as the most important support zone. Buyers have stepped in at these levels repeatedly this week. Candlestick charts show long lower wicks at this support, indicating strong buying interest.
The Relative Strength Index currently sits at 33. This reading suggests oversold conditions. The RSI has bounced from lower levels while price continues to test support, creating a mild bullish divergence.
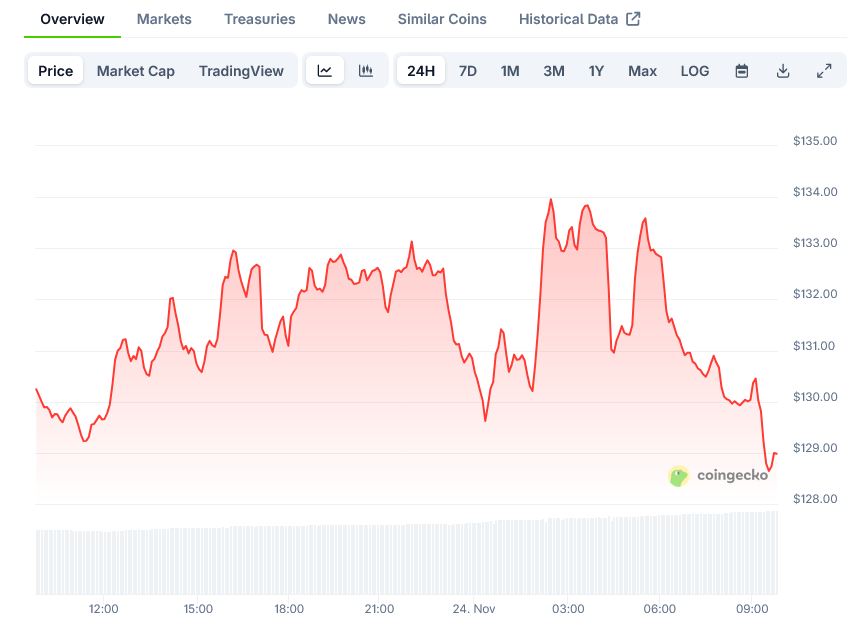 Solana Price on CoinGecko
Key Resistance Levels Ahead
The immediate resistance sits at $135. This level aligns with the 61.8% Fibonacci retracement of the recent decline from $145 to $121. Above that, the $140 level represents the next barrier.
A successful move above $144 to $146 would mark the first sign of trend strength returning. The channel’s upper boundary near $172 would need to break for a confirmed trend reversal.
The 100-hourly simple moving average is now below the current price. A bullish trend line has formed with support at $130. These technical factors provide some near-term structure for traders.
Downside Risks Remain
If the $121 support fails, the next targets sit at $107 and $95. These levels represent gaps in price structure from earlier this year. A break below $121 would activate more aggressive selling aligned with the death cross pattern.
The $127 level provides the first support below current prices. Below that, $124 serves as another defense point. A close under $124 could accelerate downside momentum toward $120.
The hourly MACD indicator is gaining pace in bullish territory. The hourly RSI has moved back above 50. These momentum indicators show some improvement from oversold extremes.
Solana recently started a recovery wave above $125 and $128. The move mirrors similar bounces in Bitcoin and Ethereum. SOL climbed above the $130 level and the 100-hourly moving average.
The post Solana (SOL) Price: Technical Analysis Shows Key Support Test at $130 Level appeared first on Blockonomi.


You May Also Like

Regulatory squeeze supports Rupee – MUFG

Loopring Price Prediction 2026, 2027 and 2030: Can LRC Be a Game-Changing Coin?


