Aerodrome Finance (AERO) Price Prediction 2026, 2027-2030
- Bullish AERO price prediction for 2026 is $0.4326 to $0.6325.
- Aerodrome Finance (AERO) price might reach $5 soon.
- Bearish AERO price prediction for 2026 is $0.1864.
In this Aerodrome Finance (AERO)price prediction 2026, 2027-2030, we will analyze the price patterns of AERO by using accurate trader-friendly technical analysis indicators and predict the future movement of the cryptocurrency.
|
TABLE OF CONTENTS
|
|
INTRODUCTION
|
|
|
AERODROME FINANCE PRICE PREDICTION 2025
|
|
| AERO PRICE PREDICTION 2026, 2027-2030 |
| CONCLUSION |
| FAQ |
Aerodrome Finance (AERO) Current Market Status
| Current Price | $0.3609 |
| 24 – Hour Price Change | 3.84% Up |
| 24 – Hour Trading Volume | $25.48M |
| Market Cap | $333.6M |
| Circulating Supply | 924.48M AERO |
| All – Time High | $2.33 ( On Dec 07, 2024) |
| All – Time Low | $0.006424 (On Dec 14, 2023) |
What is Aerodrome Finance (AERO)
| TICKER | AERO |
| BLOCKCHAIN | Base |
| CATEGORY | DEX |
| LAUNCHED ON | August 2023 |
| UTILITIES | Liquidity, Governance, Rewards, Voting, Incentives |
Aerodrome Finance (AERO) is a decentralized exchange (DEX) and automated market maker (AMM) built on the Base blockchain, designed to serve as its primary liquidity hub. Launched in August 2023, it combines efficient trading infrastructure with an incentive-driven governance model. Users can provide liquidity in both volatile and stable pools, earning rewards through swap fees and emissions. AERO introduces a vote-escrow system, where holders lock their tokens to obtain veAERO, giving them governance rights and a share of protocol fees. This system also enables “bribes” and vote-directed incentives, creating a sustainable liquidity flywheel that aligns long-term participants with ecosystem growth. By emphasizing community-driven governance, deep liquidity, and efficient capital allocation, Aerodrome Finance plays a key role in strengthening the Base ecosystem. Its model encourages collaboration between traders, liquidity providers, and protocols, positioning AERO as a foundational layer for decentralized finance on Base.
Aerodrome Finance 24H Technicals
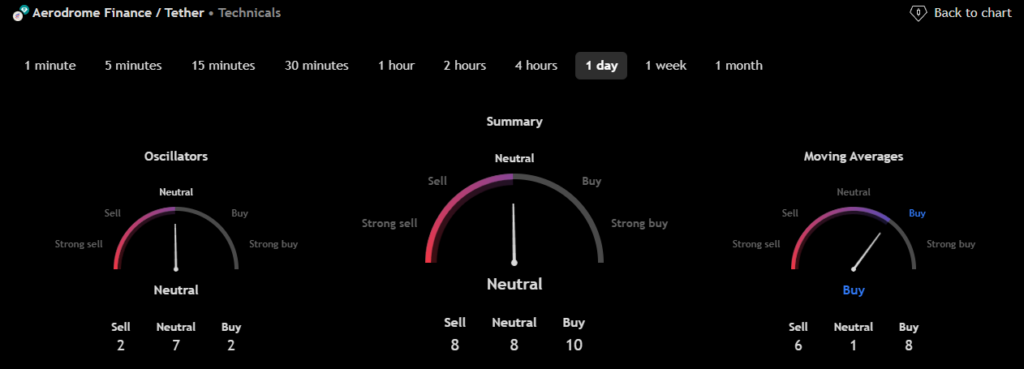 (Source: TradingView)
Aerodrome Finance (AERO) Price Prediction 2026
Aerodrome Finance (AERO) ranks 100th on CoinMarketCap in terms of its market capitalization. The overview of the Aerodrome Finance price prediction for 2026 is explained below with a daily time frame.
In the above chart, Aerodrome Finance (AERO) laid out a descending channel pattern. Descending channel patterns are short-term bearish in that a stock moves lower within a descending channel, but they often form longer-term uptrends as continuation patterns. Higher prices often follow the descending channel pattern. But only after an upside penetration of the upper trend line. A descending channel is drawn by connecting the lower highs and lower lows of a security’s price with parallel trendlines to show a downward trend.
A trader could make a selling bet within a descending channel when the security price reaches its resistance trendline. An ascending channel is the opposite of a descending channel. Both ascending and descending channels are primary technical indicators followed by analysts.
At the time of analysis, the price of Aerodrome Finance (AERO) was recorded at $0.3609. If the pattern trend continues, then the price of AERO might reach the resistance levels of $0.3905 and $1.2919. If the trend reverses, then the price of AERO may fall to the support level of $0.2687.
Aerodrome Finance (AERO) Resistance and Support Levels
The chart given below elucidates the possible resistance and support levels of Aerodrome Finance (AERO) in 2026.
From the above chart, we can analyze and identify the following as resistance and support levels of Aerodrome Finance (AERO) for 2026.
| Resistance Level 1 | $0.4326 |
| Resistance Level 2 | $0.6325 |
| Support Level 1 | $0.2739 |
| Support Level 2 | $0.1864 |
AERO Resistance & Support Levels
Aerodrome Finance (AERO) Price Prediction 2026 — RVOL, MA, and RSI
The technical analysis indicators such as Relative Volume (RVOL), Moving Average (MA), and Relative Strength Index (RSI) of Aerodrome Finance (AERO) are shown in the chart below.
From the readings on the chart above, we can make the following inferences regarding the current Aerodrome Finance (AERO) market in 2026.
| INDICATOR | PURPOSE | READING | INFERENCE |
| 50-Day Moving Average (50MA) | Nature of the current trend by comparing the average price over 50 days | 50 MA = $0.3810Price = $0.3653 (50MA > Price) |
Bearish/Downtrend |
| Relative Strength Index (RSI) | Magnitude of price change;Analyzing overAEROd & overbought conditions | 53.6386 <30 = Oversold 50-70 = Neutral>70 = Overbought |
Neutral |
| Relative Volume (RVOL) | Asset’s trading volume in relation to its recent average volumes | Below cutoff line | Weak volume |
Aerodrome Finance (AERO) Price Prediction 2026 — ADX, RVI
In the below chart, we analyze the strength and volatility of Aerodrome Finance (AERO) using the following technical analysis indicators — Average Directional Index (ADX) and Relative Volatility Index (RVI).
From the readings on the chart above, we can make the following inferences regarding the price momentum of Aerodrome Finance (AERO).
| INDICATOR | PURPOSE | READING | INFERENCE |
| Average Directional Index (ADX) | Strength of the trend momentum | 10.9166 | Weak Trend |
| Relative Volatility Index (RVI) | Volatility over a specific period | 57.50 <50 = Low >50 = High |
High Volatility |
Comparison of AERO with BTC, ETH
Let us now compare the price movements of Aerodrome Finance (AERO) with those of Bitcoin (BTC) and Ethereum (ETH).
From the above chart, the price action of AERO is similar to that of BTC and ETH. That is, when the price of BTC and ETH increases or decreases, the price of AERO also increases or decreases, respectively.
Aerodrome Finance (AERO) Price Prediction 2027, 2028– 2030
With the help of the aforementioned technical analysis indicators and trend patterns, let us predict the price of Aerodrome Finance (AERO) between 2027, 2028, 2029, and 2030.
| Year | Bullish Price | Bearish Price |
| Aerodrome Finance (AERO) Price Prediction 2027 | $7 | $0.1 |
| Aerodrome Finance (AERO) Price Prediction 2028 | $9 | $0.09 |
| Aerodrome Finance (AERO) Price Prediction 2029 | $11 | $0.08 |
| Aerodrome Finance (AERO) Price Prediction 2030 | $13 | $0.07 |
Conclusion
If Aerodrome Finance (AERO) establishes itself as a good investment in 2026, this year will be favorable to cryptocurrency. In conclusion, the bullish Aerodrome Finance (AERO) price prediction for 2026 is $0.6325. Comparatively, if an unfavorable sentiment is triggered, the bearish Aerodrome Finance (AERO) price prediction for 2026 is $0.1864.
If the market momentum and investors’ sentiments positively elevate, then Aerodrome Finance (AERO) might hit $5. Furthermore, with future upgrades and advancements in the Aerodrome Finance ecosystem, AERO might surpass its current all-time high (ATH) of $2.33 and mark a new ATH.
FAQ
1. What is Aerodrome Finance (AERO)?
Aerodrome Finance (AERO) is a decentralized exchange (DEX) and automated market maker (AMM) built on the Base blockchain, designed to serve as its primary liquidity hub.
2. Where can you purchase Aerodrome Finance (AERO)?
Aerodrome Finance (AERO) has been listed on many crypto exchanges which include KuCoin, Kraken, Bybit, gate.io, MEXC Global, Coinbase Pro, CoinEx, Bitget, Phemex, XT.com.
3. Will Aerodrome Finance (AERO) reach a new ATH soon?
With the ongoing developments and upgrades within the Aerodrome Finance Platform, AERO has a high possibility of reaching its ATH soon.
4. What is the current all-time high (ATH) of Aerodrome Finance (AERO)?
On December 07, 2024, AERO reached its new all-time high (ATH) of $2.33.
5. What is the lowest price of Aerodrome Finance (AERO)?
According to CoinMarketCap, AERO hit its all-time low (ATL) of $0.006424 on December 14, 2023.
6. Will Aerodrome Finance (AERO) reach $5?
If Aerodrome Finance (AERO) becomes one of the active cryptocurrencies that maintains a bullish trend, it might rally to hit $5 soon.
7. What will be the Aerodrome Finance (AERO) price by 2027?
Aerodrome Finance (AERO) price is expected to reach $7 by 2027.
8. What will be the Aerodrome Finance (AERO) price by 2028?
Aerodrome Finance (AERO) price is expected to reach $9 by 2028.
9. What will be the Aerodrome Finance (AERO) price by 2029?
Aerodrome Finance (AERO) price is expected to reach $11 by 2029.
10. What will be the Aerodrome Finance (AERO) price by 2030?
Aerodrome Finance (AERO) price is expected to reach $13 by 2030.
Top Crypto Predictions
MANTRA (OM) Price Prediction
Algorand (ALGO) Price Prediction
XRP (XRP) Price Prediction
Disclaimer: The opinion expressed in this article is solely the author’s. It does not represent any investment advice. TheNewsCrypto team encourages all to do their own research before investing.


You May Also Like

Bitcoin treasury sell-off accelerates as Riot, Bhutan, and public companies exit positions

Will Michael Saylor and Strategy Sell Bitcoin Soon? New Claims and Information Have Emerged