

Aster token price forms double bottom, price targeting $1.06?

Aster token price forms a clear double-bottom pattern at high-time-frame support, raising expectations of a potential rebound toward the $1.06–$1.09 resistance zone.
- Buying interest is returning as Aster stabilizes at a crucial price level.
- Recent trading behavior hints at momentum gradually shifting upward.
- A breakout above near-term resistance could attract renewed market attention.
Aster (ASTR) token price is showing early signs of a potential bullish reversal as price action develops a clear double-bottom structure around a major high-time-frame support level. After weeks of selling pressure, the token is stabilizing at a region where historical reactions have generated strong upside movements.
The emerging double bottom, combined with notable technical confluence at this price level, is fueling speculation that Aster may soon attempt a recovery toward the $1.06–$1.09 resistance band.
Aster token price key technical points
- Aster is forming a double-bottom pattern at the $0.91 high-time-frame support.
- The value area low aligns with this level, creating strong structural confluence.
- A reclaim of $1.09 resistance could open the path toward $1.36, the high value area.
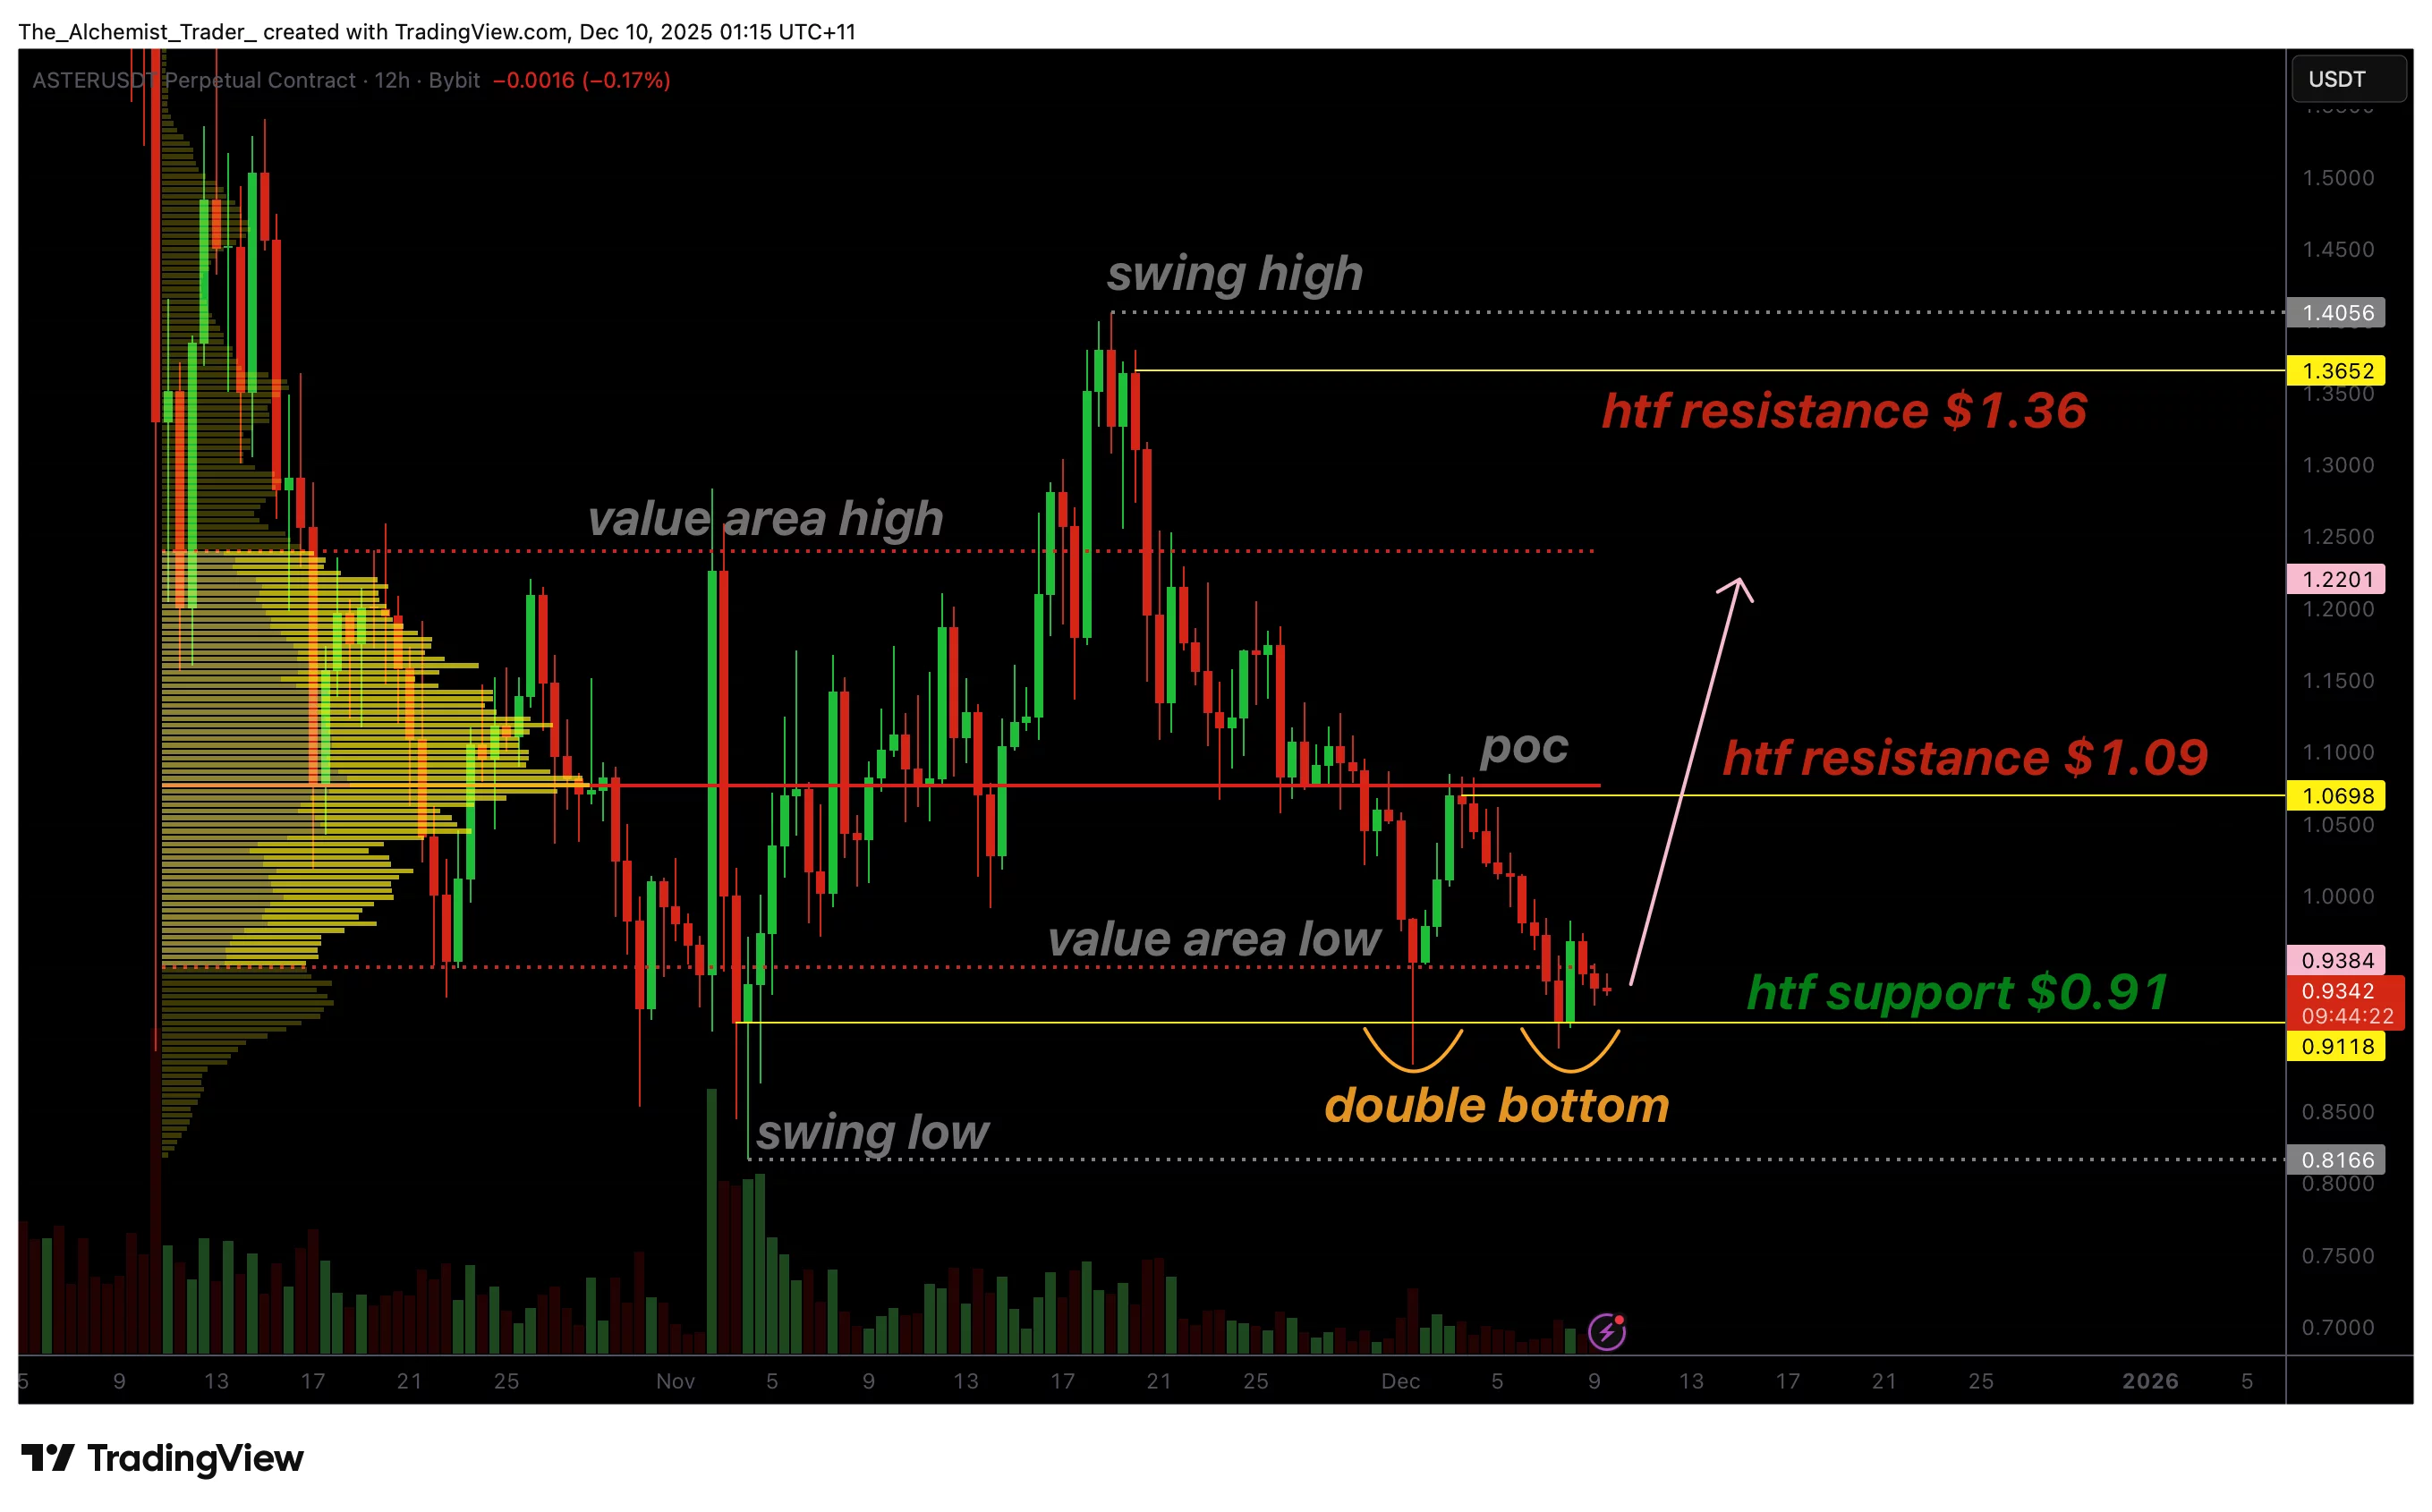
The current double-bottom formation on Aster is taking shape at one of the most technically significant zones on the chart. The $0.91 support level has served as a decisive pivot in previous market cycles, where price reactions have consistently led to bullish expansions.
This time, the level aligns not only with historic support, but also with the value area low, forming a high-volume zone where buyers have historically stepped in. Such confluence strengthens the likelihood that this local bottom could evolve into a broader bullish structure. Market structure around this region further supports the double-bottom narrative.
Price has now held above $0.91 for several consecutive days, reinforcing the integrity of the pattern. A second successful retest suggests that supply is weakening at these levels while demand gradually increases. Each candle close above this support adds credibility to the pattern and increases the probability that the market is transitioning from accumulation toward expansion.
Above the current price action lies one of the most critical resistance markers: the $1.09 region, which aligns with the point of control (POC) on the volume profile. The POC represents the price level where the most trading activity occurred within the range, often acting as a magnet for price during recovery phases. A sustained reclaim of $1.09 would not only confirm the strength of the reversal, but also position Aster for a powerful move toward the next major objective at $1.36, the value area high.
If this scenario unfolds, it would trigger a full rotational movement consistent with market auction theory, in which price oscillates between high- and low-value areas. Aster currently sits near the lower boundary of this distribution, meaning the chart is offering one of the more favourable potential reversal setups from a structural standpoint.
With Aster also outlining an ambitious 2026 roadmap that includes launching its own layer-1 blockchain, broader ecosystem developments may further reinforce long-term sentiment as the market watches how price responds from this zone.
This trend of rebounds from deeply discounted levels has historically generated strong rallies in Aster’s price, and the present conditions appear aligned with those prior behaviors. However, the integrity of the double-bottom depends entirely on the $0.91 support holding. A breakdown below this level would invalidate the bullish structure and reopen the path toward lower price discovery.
What to expect in the coming price action
If Aster maintains support above $0.91 and reclaims the $1.09 POC resistance, momentum is likely to strengthen, with a high-probability target at $1.36. Failure to hold support would invalidate the double bottom and shift the bias back to bearish.


You May Also Like

Leadership Shift at Stack BTC Raises Questions About Strategy, Stability, and Crypto Market Risks

Bitcoin treasury sell-off accelerates as Riot, Bhutan, and public companies exit positions


