Bitcoin’s “death cross” is back in the group chat. And yes, the emails too. Matthew Sigel, head of digital assets research at VanEck, said he’s been “getting questionsBitcoin’s “death cross” is back in the group chat. And yes, the emails too. Matthew Sigel, head of digital assets research at VanEck, said he’s been “getting questions

Bitcoin ‘Death Cross’ Panic Returns: History Says It’s A Late Signal

2025/12/17 19:00

Bitcoin’s “death cross” is back in the group chat. And yes, the emails too. Matthew Sigel, head of digital assets research at VanEck, said he’s been “getting questions from clients” about the latest death cross print — the 50-day moving average slipping under the 200-day — and answered with the kind of data dump that tends to calm people down.

“Lagging indicator,” Sigel wrote on X, alongside a table of every Bitcoin death cross going back to 2011. The summary stats are clean: the 6-month median return after a death cross is +30%, the 12-month median is +89%, and the “positive hit rate” is 64%.

Another Bitcoin Death Cross, Another Missed Bottom?

But the interesting bit isn’t just the returns. It’s Sigel’s market regime column — basically a hint that the same technical signal can mean wildly different things depending on where you are in the cycle.

Bitcoin death cross history

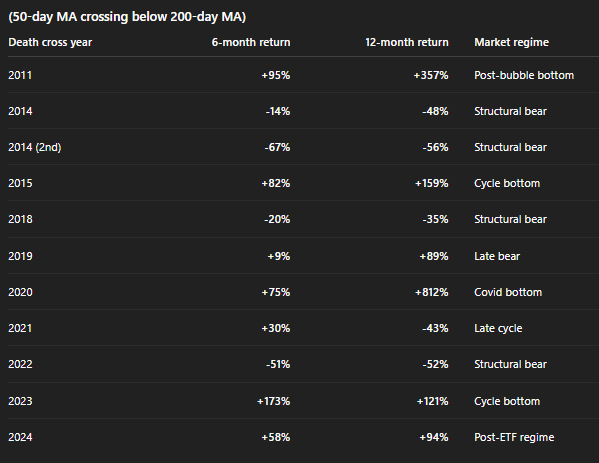
Take the ones tagged as some version of “bottom.” In 2011 (“post-bubble bottom”), the death cross showed up around the wreckage of an early-cycle blow-off, and the next 12 months were +357%. In 2015 (“cycle bottom”), it was +82% at six months and +159% at 12 months — classic post-capitulation behavior where trend indicators catch up late, after price has already stabilized and started to turn.

2020 (“Covid bottom”) is the extreme example: forced liquidation, policy response, then a monster rebound (+812% over 12 months). And 2023 is also tagged “cycle bottom,” with +173% at six months and +121% at 12 months — the kind of “this is awful until it isn’t” regime crypto does better than any asset class.

Now look at “structural bear.” That label shows up in 2014 (twice), 2018, and 2022 — and the forward returns are mostly ugly: 2014 prints -48% and -56% over 12 months, 2018 is -35%, and 2022 is -52%. Different environment. Less “washout and bounce,” more “trend is down because the system is deleveraging,” whether that’s miners, credit, exchanges, or macro liquidity tightening. In those regimes, a death cross isn’t a late alarm — it’s the moving averages confirming that the downtrend is real and persistent.

The in-between tags matter too. 2019 is marked “late bear,” with +9% at six months and +89% at 12 — choppy, uneven, but improving as the cycle turns. 2021 is “late cycle”: +30% at six months, then -43% at 12, which fits a regime where trend signals can whipsaw while distribution and macro tightening creep in.

And then there’s 2024: “post-ETF regime,” with +58% at six months and +94% at 12. That tag is doing a lot of work. It suggests the backdrop isn’t just “price vs. moving averages,” but structural demand (ETFs), different liquidity plumbing, and a market that may behave less like pure reflexive leverage and more like a hybrid of trad-fi flows plus crypto-native positioning.

So the takeaway isn’t “death crosses are bullish.” That’s not true. It’s that the signal is mostly a trailing mirror — and the regime you’re actually in (bottoming, late bear, structural deleveraging, late cycle, post-ETF flow market) is what decides whether it’s a fake-out, a confirmation, or just noise with a scary name.

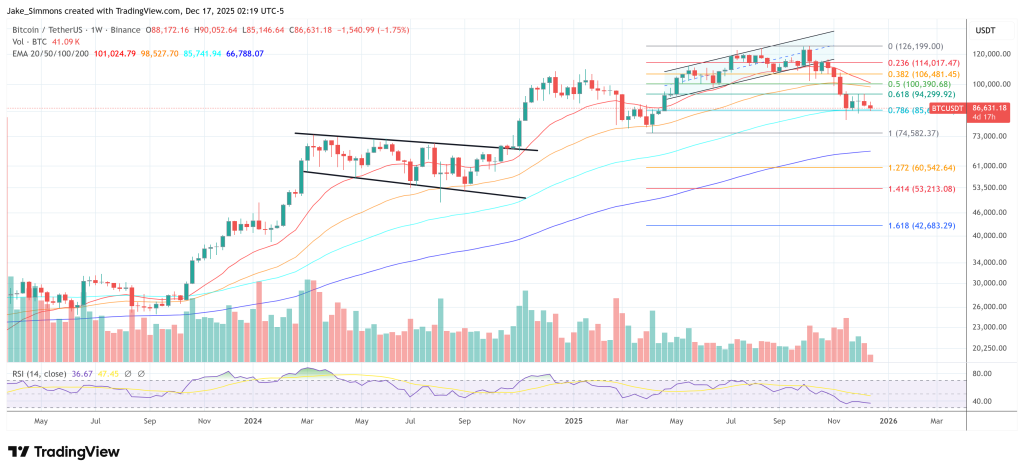
At press time, Bitcoin traded at $86,631.

Bitcoin price
Market Opportunity
CROSS Logo
CROSS Price(CROSS)
$0.12717
$0.12717$0.12717
-0.81%
USD
CROSS (CROSS) Live Price Chart
Disclaimer: The articles reposted on this site are sourced from public platforms and are provided for informational purposes only. They do not necessarily reflect the views of MEXC. All rights remain with the original authors. If you believe any content infringes on third-party rights, please contact service@support.mexc.com for removal. MEXC makes no guarantees regarding the accuracy, completeness, or timeliness of the content and is not responsible for any actions taken based on the information provided. The content does not constitute financial, legal, or other professional advice, nor should it be considered a recommendation or endorsement by MEXC.

You May Also Like

Woodway Assurance receives $1 million in funding for data privacy assurance solution EviData

Woodway Assurance receives $1 million in funding for data privacy assurance solution EviData

OTTAWA, ON, Dec. 17, 2025 /PRNewswire/ – New Canadian technology company Woodway Assurance is proud to announce that it has closed an oversubscribed seed funding
Share
AI Journal2025/12/17 23:16
OpenVPP accused of falsely advertising cooperation with the US government; SEC commissioner clarifies no involvement

OpenVPP accused of falsely advertising cooperation with the US government; SEC commissioner clarifies no involvement

PANews reported on September 17th that on-chain sleuth ZachXBT tweeted that OpenVPP ( $OVPP ) announced this week that it was collaborating with the US government to advance energy tokenization. SEC Commissioner Hester Peirce subsequently responded, stating that the company does not collaborate with or endorse any private crypto projects. The OpenVPP team subsequently hid the response. Several crypto influencers have participated in promoting the project, and the accounts involved have been questioned as typical influencer accounts.
Share
PANews2025/09/17 23:58
BlackRock boosts AI and US equity exposure in $185 billion models

BlackRock boosts AI and US equity exposure in $185 billion models

The post BlackRock boosts AI and US equity exposure in $185 billion models appeared on BitcoinEthereumNews.com. BlackRock is steering $185 billion worth of model portfolios deeper into US stocks and artificial intelligence. The decision came this week as the asset manager adjusted its entire model suite, increasing its equity allocation and dumping exposure to international developed markets. The firm now sits 2% overweight on stocks, after money moved between several of its biggest exchange-traded funds. This wasn’t a slow shuffle. Billions flowed across multiple ETFs on Tuesday as BlackRock executed the realignment. The iShares S&P 100 ETF (OEF) alone brought in $3.4 billion, the largest single-day haul in its history. The iShares Core S&P 500 ETF (IVV) collected $2.3 billion, while the iShares US Equity Factor Rotation Active ETF (DYNF) added nearly $2 billion. The rebalancing triggered swift inflows and outflows that realigned investor exposure on the back of performance data and macroeconomic outlooks. BlackRock raises equities on strong US earnings The model updates come as BlackRock backs the rally in American stocks, fueled by strong earnings and optimism around rate cuts. In an investment letter obtained by Bloomberg, the firm said US companies have delivered 11% earnings growth since the third quarter of 2024. Meanwhile, earnings across other developed markets barely touched 2%. That gap helped push the decision to drop international holdings in favor of American ones. Michael Gates, lead portfolio manager for BlackRock’s Target Allocation ETF model portfolio suite, said the US market is the only one showing consistency in sales growth, profit delivery, and revisions in analyst forecasts. “The US equity market continues to stand alone in terms of earnings delivery, sales growth and sustainable trends in analyst estimates and revisions,” Michael wrote. He added that non-US developed markets lagged far behind, especially when it came to sales. This week’s changes reflect that position. The move was made ahead of the Federal…
Share
BitcoinEthereumNews2025/09/18 01:44