TRX price flashes wedge as top Tron network metrics jump
TRX price rose for the fourth consecutive day as investors bought the dip, key Tron metrics improved, and a bullish chart pattern formed.
- Tron price has formed a falling wedge pattern on the daily chart.
- The number of Tron transactions has jumped by 12% in the last 30 days.
- Tron’s market share in the stablecoin industry is growing.
Tron (TRX) rose to a high of $0.2800, up slightly from this month’s low of $0.22715.
Third-party data shows that some key metrics on Tron are doing well. For example, according to Artemis, the supply of stablecoins on Tron increased by 2.5% in the last 30 days to $81 billion.
The supply, driven by Tether, increased as the number of stablecoin addresses in the network rose by 4.84% to 11.5 million. These two numbers make Tron the second-biggest chain in the stablecoin industry, after Ethereum (ETH).
Additional data indicate that the number of stablecoin transactions increased by 3.7% to 78 million. This translated to an adjusted volume of over $703 billion.
Meanwhile, according to Nansen, Tron network handled 313 million transactions in the last 30 days. These transactions increased by 12%, which is notable because other popular chains, such as Solana, Ethereum, and BNB Chain, saw their transaction volumes decline.
While Tron’s transactions rose, the number of active addresses dropped by 23% to 16.7 million, while its fees fell by 12% to $29 million. Its fees declined recently by 60% due to a network-wide reduction.
Tron generated $597 million in fees in the last 12 months, higher than the $587 million that Ethereum made in the same period.
Tron’s fees help to moderate the number of TRX tokens in circulation. TronScan data shows that there are now 94.4 billion TRX tokens in circulation, down from 95 billion in January.
TRX price technical analysis as a falling wedge forms
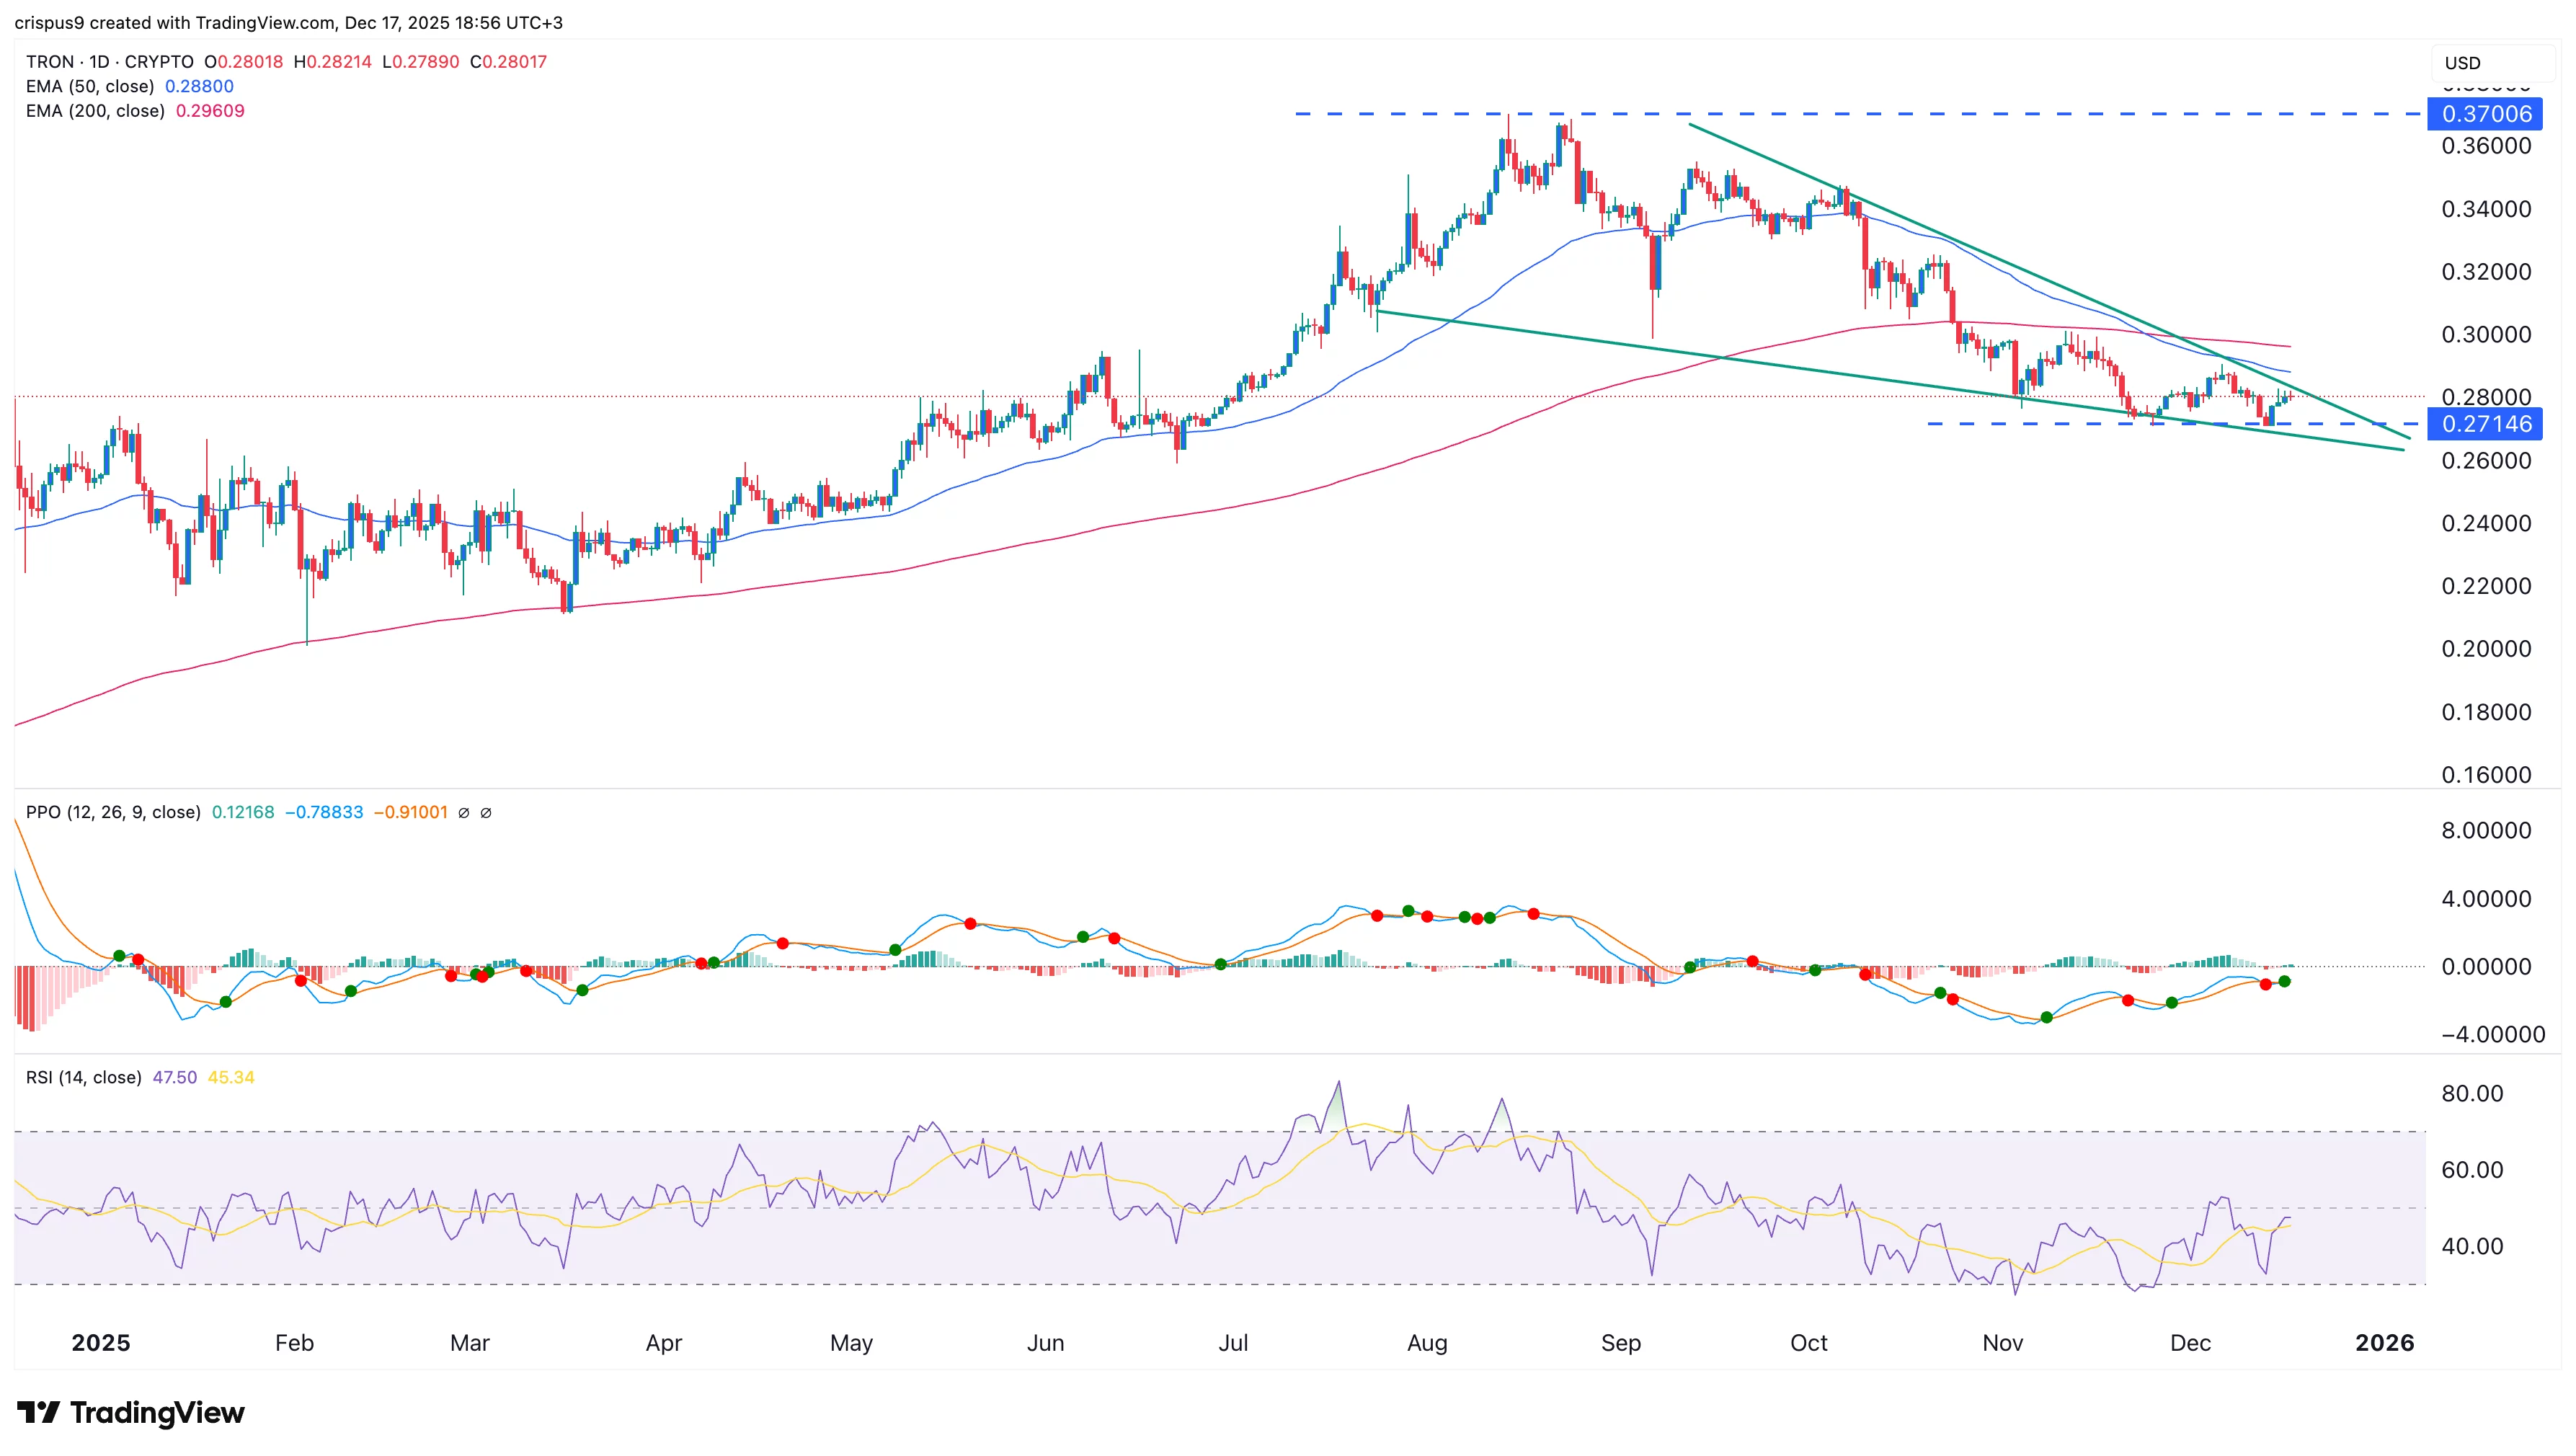
The daily chart indicates that the TRX token has been in a pronounced downward trend over the past few months. It dropped from the year-to-date high of $0.3700 to the current $0.795.
On the negative side, the token formed the bearish death cross pattern last month. That pattern typically fuels further downside, as it indicates that bears have prevailed.
However, some technicals point to a rebound. It has formed a falling wedge pattern, while the Percentage Price Oscillator and the Relative Strength Index have formed a bullish divergence.
Therefore, while the death cross pattern indicates further downside, the falling wedge and bullish divergence suggest that further upside is possible in the coming weeks.


You May Also Like

Pi Network Strengthens Its Vision for Web3 Utility Driven Ecosystems

The Chemistry of UV Resistance: How Titanium Dioxide Protects Against the California Sun