The Gold-to-Bitcoin Rotation Narrative Gains Strength: A Data-Driven Review
Bitcoin is once again attempting to reclaim the $90,000 level, but price action remains capped below this key psychological threshold. Despite several short-lived relief rallies, momentum has failed to follow through, reinforcing growing concerns that the broader market structure is weakening.
As volatility persists and upside attempts stall, an increasing number of analysts are beginning to openly discuss the possibility that Bitcoin may be transitioning into a bear market phase. Sentiment across derivatives and spot markets has turned noticeably more cautious, with risk appetite continuing to fade.
In this context, a recent report by Darkfost draws attention to a familiar but controversial narrative: capital rotation from gold into Bitcoin. With gold setting a new all-time high above $4,420 per ounce, the idea that investors may soon shift capital toward Bitcoin is resurfacing across the market.
Historically, this narrative has gained traction during periods when traditional safe-haven assets outperform, fueling speculation that Bitcoin could follow as an alternative store of value.
However, Darkfost cautions that this assumption is far from well-grounded. While the rotation thesis has been widely repeated throughout this cycle, empirical evidence linking gold outperformance directly to sustained Bitcoin inflows remains weak.
Rather than signaling an imminent bullish turn, the current setup suggests that Bitcoin remains vulnerable, caught between macro-driven narratives and deteriorating internal market structure.
Testing the Gold-to-Bitcoin Rotation Thesis
Darkfost emphasizes that the popular narrative of capital rotating from gold into Bitcoin lacks direct, verifiable evidence. To address this, he constructed a comparative framework to identify periods where such rotations may have occurred. He did this without assuming a causal relationship. The core issue, as he notes, is that on-chain and market data cannot conclusively prove that capital exiting gold is the same capital entering Bitcoin.
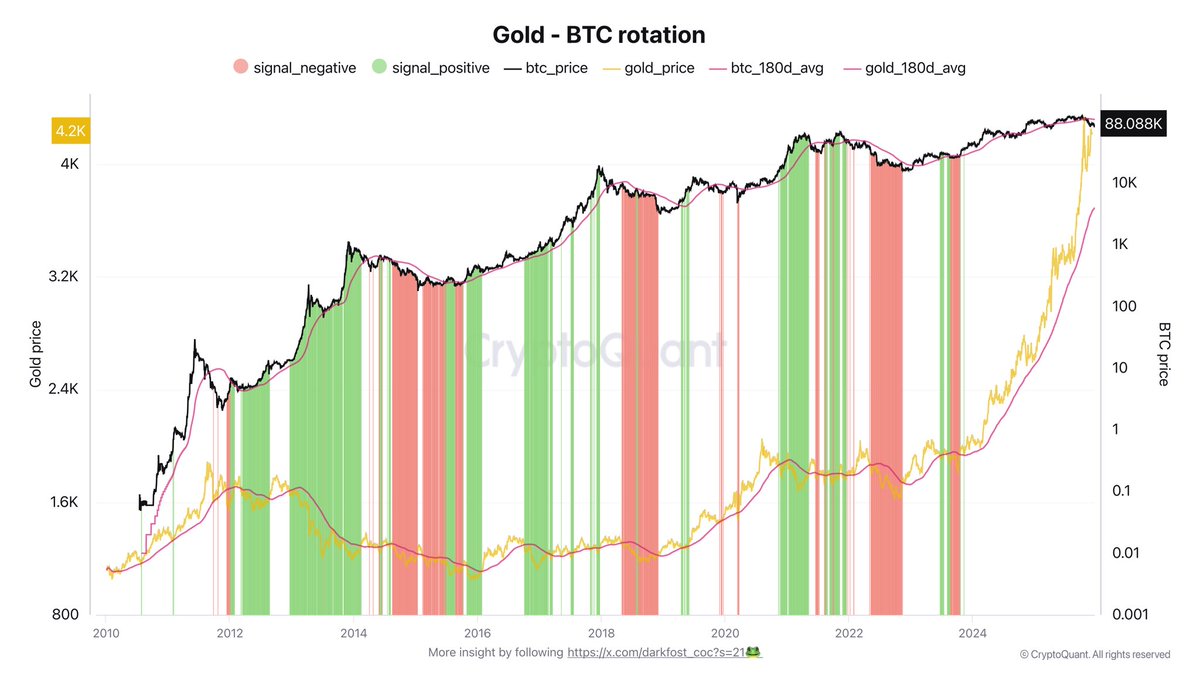
To approximate potential rotation phases, Darkfost applied a simple but disciplined signal structure. A positive signal appears when Bitcoin is trading above its 180-day moving average while gold is trading below its own 180-day moving average. In theory, this configuration suggests relative strength shifting toward Bitcoin. Conversely, a negative signal is triggered when both Bitcoin and gold trade below their respective 180-day moving averages. Indicating a broad risk-off environment rather than a rotation.
This methodology allows historical comparison across cycles, highlighting moments where relative performance diverged. However, the results challenge the simplicity of the narrative. As shown on the chart, these signals do not produce consistent or reliable outcomes. In several instances, supposed rotation periods failed to generate sustained upside for Bitcoin. At other times, Bitcoin rallied independently of gold’s trend.
The takeaway is clear: capital rotation between gold and Bitcoin is not an absolute or mechanical process. Market behavior appears far more nuanced. Driven by broader macro conditions, liquidity dynamics, and investor positioning rather than a straightforward asset-to-asset rotation.
Price Struggles Below Key Moving Averages
Bitcoin is attempting to stabilize after a sharp corrective phase, but the chart highlights that price action remains structurally fragile. BTC is currently trading just below the $90,000 level, an area that has flipped from support into near-term resistance following the recent breakdown. While the latest bounce shows short-term buying interest, it has not yet altered the broader bearish structure that formed after the October highs.

From a trend perspective, Bitcoin is now trading below the 50-3D moving average (blue), which has started to slope downward, signaling weakening momentum. The failure to reclaim this level suggests that recent upside moves are corrective rather than impulsive.
Below the current price, the 100-3D moving average (green) sits near the $85,000–$86,000 zone and has acted as interim support during the rebound. A sustained loss of this area would likely expose BTC to a deeper retracement toward the 200-3D moving average (red), currently rising near the low $80,000 region.
The sell-off was accompanied by elevated volume. While the rebound has occurred on comparatively lighter participation, pointing to a lack of conviction from buyers. Structurally, Bitcoin is consolidating in a lower range. With lower highs and compressed volatility suggesting a pause rather than a trend reversal.
For bulls, reclaiming and holding above $90,000 and the declining 50-3D moving average is critical to invalidate the bearish bias. Until then, price action favors range-bound trading with downside risk still present.
Featured image from ChatGPT, chart from TradingView.com


You May Also Like

WTI Oil eases to $87.50 amid a fragile US-Iran ceasefire

Volo Protocol Loses $3.5 Million in Sui Vault Exploit Amid DeFi Hack Streak