Can FLOKI Maintain Support and Build Momentum After Recent Uptick in Price?
- FLOKI has moved above $0.000049 and is showing signs of stabilizing.
- Support around $0.000041–$0.000043 will be important to keep the price steady.
FLOKI (FLOKI) is currently trading around $0.000048, showing a positive move in recent sessions with over 20% gains in the past 24 hours and elevated volume indicating renewed interest. This move has lifted FLOKI from the mid‑$0.00004 range that it struggled around for several weeks, and placed it near the first significant resistance zone. Recent data suggests that the meme‑inspired token is attempting to break out of a prolonged sideways drift.
- Immediate Support: $0.00004107 to $0.00004357 — this zone has acted as a short‑term floor over the last few weeks.
- Next Support: $0.0000392 and the stronger line closer to $0.0000388.
- Near‑Term Resistance: ~$0.00005112, then $0.00005244–$0.0000612 area. A move above these levels would confirm further short‑term strength.
- Major Resistance: ~$0.0001022. A decisive break above this could signal a more sustained recovery phase.
Trend Patterns & Chart Signal
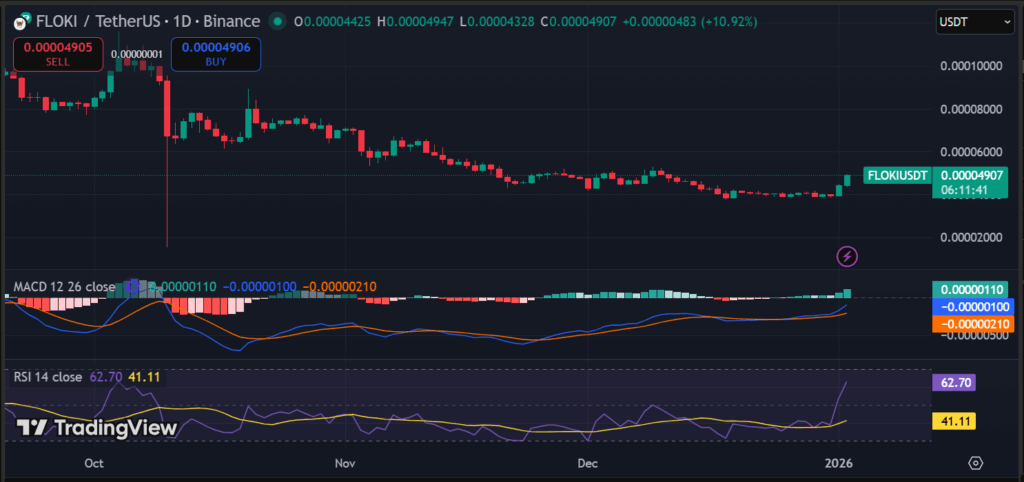
Over the past month, FLOKI has largely traded in a horizontal consolidation range, oscillating near support levels without establishing a clear uptrend. The recent uptick and breakout attempt, with the price rising to 0.00004907 USDT, is the first meaningful push above this range in weeks. If buyers defend lower support levels on pullbacks, this could evolve into a short-term base breakout pattern.
 (Source: TradingView)
Moving Averages: Short-term averages are close to the current price, while longer-term averages remain above, indicating past downtrend pressure has not fully reversed.
MACD: The MACD line is at 0.00000110, above the signal line at -0.00000100, with the histogram at -0.00000210, showing reduced selling pressure and a slight bullish momentum.
RSI: The 14-day RSI is at 62.70, which is slightly over the neutral zone, suggesting buyers are stepping in after a recent bounce.
Zooming out, FLOKI has shown early signs of stabilization and a potential shift from bearish consolidation to a neutral-to-bullish bias. The breakout above recent resistance, coupled with RSI moving toward bullish territory and easing MACD negativity, are constructive short-term signals.
However, broader trend signals — mixed moving averages and sell‑biased longer‑term indicators — suggest the token has not fully regained a sustained uptrend yet. Confirmation of a more durable reversal would require:
- Holding above the $0.0000400 support area on pullbacks.
- Clearing key resistance above ~$0.0000513.
- Strengthening momentum readings — RSI stays above 50 and MACD widening above signal.
If FLOKI fails to maintain the current support zone, it could slip back into the $0.00004357–$0.0000388 area. That reinforcing the sideways pressure seen over recent weeks.


You May Also Like

EdgeX (EDGE) Surges 46.6% to New ATH: Volume Analysis Reveals Unusual Pattern

Top Analyst Explains Why Robinhood Stock is Ripe for a Comeback