

What Is the Benner Cycle and Why Is It Warning Investors to Sell in 2026?
BitcoinWorld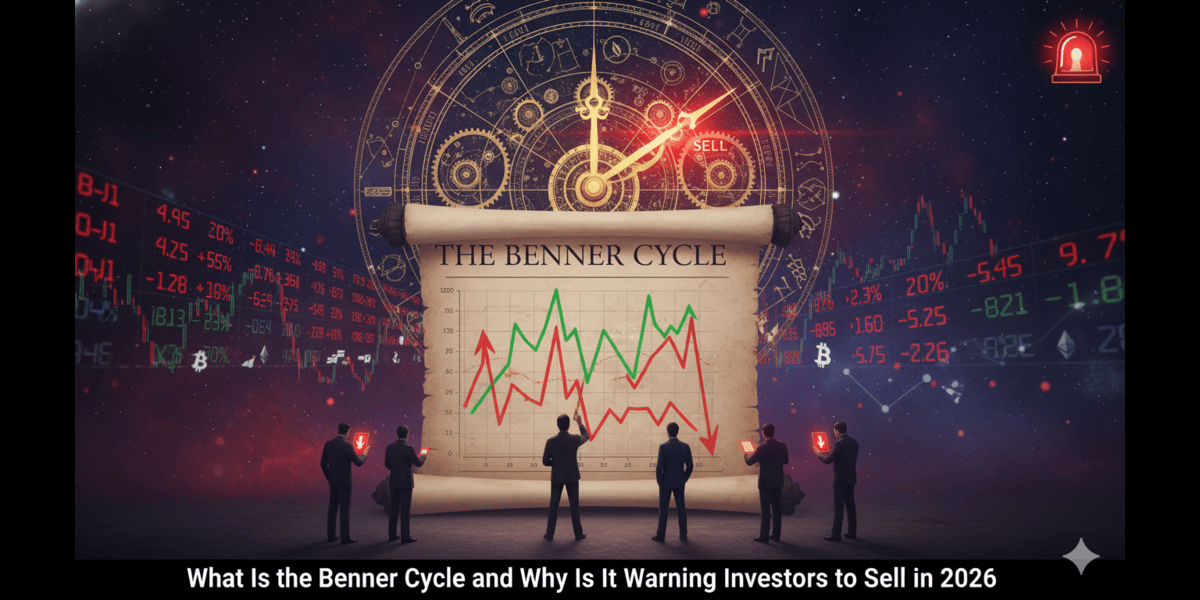
What Is the Benner Cycle and Why Is It Warning Investors to Sell in 2026?
The Benner Cycle, also known as the “Periods When to Make Money” chart, is a 150-year-old market forecasting tool that has gained renewed attention for identifying 2026 as a critical market peak. Created by Samuel Benner in 1875, this cyclical model suggests that the global economy follows a rhythmic pattern of booms and busts tied to agricultural and solar cycles. As of early 2026, the chart categorizes the current year as a time of “Good Times” and high prices, issuing a clear historical signal to sell assets before a predicted downturn begins.
What Is the History and Methodology of the Benner Cycle?
Samuel Benner, a prosperous Ohio farmer who was wiped out financially during the Panic of 1873, developed the chart to understand the causes of market fluctuations. He theorized that market cycles were not random but followed predictable patterns driven by solar activity and its effect on crop yields (specifically pig iron, corn, and hogs).
The chart divides economic history into three distinct repeating phases:
- A – Panic Years: Periods characterized by extreme fear, market crashes, and panic selling (e.g., historical markers like 1927, 1999, and the prediction for 2019).
- B – Good Times: Years defined by prosperity, high asset prices, and exuberant market sentiment. This is the designated window to sell stocks and real estate.
- C – Hard Times: Eras of low prices and economic stagnation. Benner identified these as the optimal times to buy and hold assets cheaply.
How Accurate Has the Benner Cycle Been Over the Last 150 Years?
The Benner Cycle is often described as “eerily accurate” by financial historians, though it is not without flaws. Its long-term track record includes several major successful predictions that keep it relevant in modern technical analysis.
- Major Hits: The chart correctly identified the 1929 stock market crash, the 1999 Dot-com bubble peak, the 2007 pre-crash high before the Global Financial Crisis, and the “Hard Times” buying window of 2023.
- Notable Misses: The cycle is not infallible. It predicted a panic year in 2019, but the actual market crash did not occur until the COVID-19 pandemic in early 2020, representing a one-year deviation. Additionally, it forecasted “Hard Times” during 1965, which was actually a year of robust economic growth.
What Does the Benner Cycle Predict for 2026?
In the context of 2026, the Benner Cycle is interpreted as a major warning signal for investors holding risk assets.
- The “Good Times” Peak: 2026 is labeled as a Category B year. This indicates a period of peak market sentiment and high prices, suggesting that the market will reach its zenith in late 2026 or early 2027.
- The “Sell” Signal: The explicit instruction from the chart for this phase is to take profits. The cycle suggests that following this peak, the economy will enter a “Hard Times” phase that could potentially last until 2032, making capital preservation a priority.
- Cryptocurrency Alignment: Modern crypto analysts have noted a strong correlation between the Benner Cycle and the Bitcoin halving cycles. Many forecast that the 2026 peak aligns with a post-halving high for Bitcoin (with estimates reaching $250,000) before a severe cyclical correction.
- Solar Cycle Correlation: The prediction is further supported by modern data on solar activity, which is forecast to peak in the 2025–2026 window, aligning with Benner’s original thesis that solar intensity influences economic productivity and psychology.
Frequently Asked Questions
Is the Benner Cycle reliable for predicting stock market crashes?
While the Benner Cycle has an impressive track record—accurately calling the 1929 and 2008 crashes—it should not be used as a standalone indicator. It is a long-term cyclical map rather than a precise daily trading tool, and it has had deviations, such as the one-year lag between the predicted 2019 panic and the actual 2020 COVID crash.
What should I do with my investments in 2026 according to the chart?
According to the Benner Cycle, 2026 is a “Good Times” year, which is the specific phase where investors are advised to sell and liquidate assets to lock in high prices. The chart warns that holding assets beyond this peak exposes investors to the subsequent “Hard Times” phase of deflation and low prices.
How does the Benner Cycle relate to Bitcoin in 2026?
Although Samuel Benner created the chart in 1875 well before cryptocurrency existed, modern analysts use it to track Bitcoin’s 4-year market cycles. The 2026 “Good Times” prediction aligns with the expected parabolic top of the crypto market following the 2024 halving, suggesting a major top for digital assets this year.
Conclusion
The Benner Cycle serves as a fascinating and historically weighty lens through which to view the 2026 financial markets. By categorizing 2026 as a peak year of “Good Times,” it offers a contrarian signal to widespread bullishness, urging investors to consider taking profits before a potential long-term downturn. Whether driven by solar cycles, agricultural yields, or human psychology, the chart’s 150-year legacy commands attention from anyone looking to navigate the transition from market euphoria to the predicted “Hard Times” ahead.
This post What Is the Benner Cycle and Why Is It Warning Investors to Sell in 2026? first appeared on BitcoinWorld.


You May Also Like

The changing face of elder care in Malaysia — Sayed Mohammad Reza Yamani Sayed Umar

Covéa Chooses Shift Technology as Strategic Partner for Fraud and Risk Management

Not a loophole: Singapore AI export controls let China tap US AI legally


