Luisa Crawford
Jan 15, 2026 08:27
TRX Price Prediction Summary • Short-term target (1 week) : $0.32 • Medium-term forecast (1 month) : $0.32-$0.35 range • Bullish breakout level : $0.31 (current resistance) • Critical…
TRX Price Prediction Summary
• Short-term target (1 week): $0.32
• Medium-term forecast (1 month): $0.32-$0.35 range
• Bullish breakout level: $0.31 (current resistance)
• Critical support: $0.30
TRON (TRX) is currently trading at $0.31 with a 1.35% gain in the past 24 hours, positioning itself at a critical juncture as it tests key resistance levels. The cryptocurrency has shown resilience above the $0.30 support zone, with technical indicators suggesting potential for continued upward momentum.
What Crypto Analysts Are Saying About TRON
Recent analyst sentiment around TRON has been cautiously optimistic, with several predictions converging on similar price targets for the coming month.
James Ding noted on January 6, 2026: “TRON shows bullish MACD signals and RSI strength targeting $0.32-$0.35 range. Key $0.30 resistance break needed for medium-term upside continuation.” His analysis aligns with current technical readings showing TRX trading above this critical level.
Luisa Crawford provided a similar outlook on January 5, stating: “TRX price prediction shows potential 10-20% upside to $0.32-$0.35 range within 30 days, supported by bullish MACD momentum and neutral RSI positioning near resistance.”
Taking a longer-term perspective, Crypto Patel (@CryptoPatel) highlighted on January 7: “TRX is quietly building a multi-year monster base on the 2W chart. Price has respected the same rising HTF trendline since 2020. This is what long-term strength looks like.” He projects a $1.00 target for the extended timeframe.
TRX Technical Analysis Breakdown
The technical picture for TRON presents a mixed but increasingly bullish setup. The RSI reading of 68.01 places TRX in neutral territory, suggesting room for further upside movement before reaching overbought conditions. This positioning typically allows for continued momentum without immediate correction pressure.
The MACD configuration shows interesting dynamics with both the MACD line and signal line at 0.0056, while the histogram reads exactly 0.0000. This convergence suggests a potential inflection point, where momentum could accelerate in either direction based on the next price action.
TRON’s position within the Bollinger Bands is particularly noteworthy, with the %B indicator at 0.9174, meaning TRX is trading very close to the upper band resistance at $0.31. This proximity to the upper band often signals either a breakout opportunity or a potential pullback to the middle band at $0.29.
The moving average structure provides additional context, with TRX trading above most shorter-term averages. The 7-day SMA at $0.30 and 20-day SMA at $0.29 are both below the current price, while the 200-day SMA sits exactly at $0.31, creating a significant confluence at current levels.
TRON Price Targets: Bull vs Bear Case
Bullish Scenario
If TRX successfully breaks above the $0.31 resistance level with volume confirmation, the path opens toward the $0.32-$0.35 target range identified by multiple analysts. The Stochastic indicators show %K at 97.38 and %D at 77.90, suggesting strong momentum that could support this upward move.
A sustained break above $0.31 would likely trigger algorithmic buying and potentially attract momentum traders, creating the conditions for rapid appreciation toward the $0.32 level initially, followed by $0.35 as the next major target.
The bullish case is strengthened by the multi-year base formation noted by analysts, suggesting that any breakout could have substantial follow-through given the extended consolidation period.
Bearish Scenario
Should TRX fail to maintain above $0.31 or experience rejection at current levels, a pullback toward the $0.30 support becomes likely. The MACD histogram at zero indicates fragile momentum that could quickly shift bearish on any selling pressure.
A break below $0.30 would target the Bollinger Band middle line at $0.29, which coincides with the 20-day SMA. This level represents crucial support, as a failure here could lead to deeper correction toward $0.28 or the lower Bollinger Band.
The proximity to the upper Bollinger Band also increases the probability of mean reversion, especially if broader market conditions deteriorate or if TRX encounters significant selling pressure at current resistance levels.
Should You Buy TRX? Entry Strategy
For investors considering TRON positions, the current technical setup offers several strategic entry approaches. Conservative traders might wait for a confirmed breakout above $0.31 with increased volume before entering, targeting the $0.32-$0.35 range with stops below $0.30.
More aggressive traders could consider accumulating on any pullback toward the $0.30 support level, viewing it as a higher probability entry point with favorable risk-reward dynamics. This approach would allow for tighter stop-losses while maintaining upside exposure to the analyst targets.
The TRON forecast suggests implementing position sizing that accounts for the 24-hour Average True Range of $0.01, indicating relatively low volatility that could support controlled risk management strategies.
Conclusion
The TRX price prediction for the coming month appears constructive, with multiple technical and fundamental factors aligning to support the $0.32-$0.35 target range. The current positioning near $0.31 represents a critical inflection point where a successful breakout could catalyze the predicted 10-20% upside move.
However, traders should remain cautious given the mixed MACD signals and the proximity to Bollinger Band resistance. The TRON forecast carries a moderate confidence level, supported by analyst consensus but dependent on broader cryptocurrency market conditions and TRX’s ability to generate sufficient buying pressure at current levels.
This analysis is for informational purposes only and should not be considered financial advice. Cryptocurrency investments carry significant risk, and past performance does not guarantee future results. Always conduct your own research and consider your risk tolerance before making investment decisions.
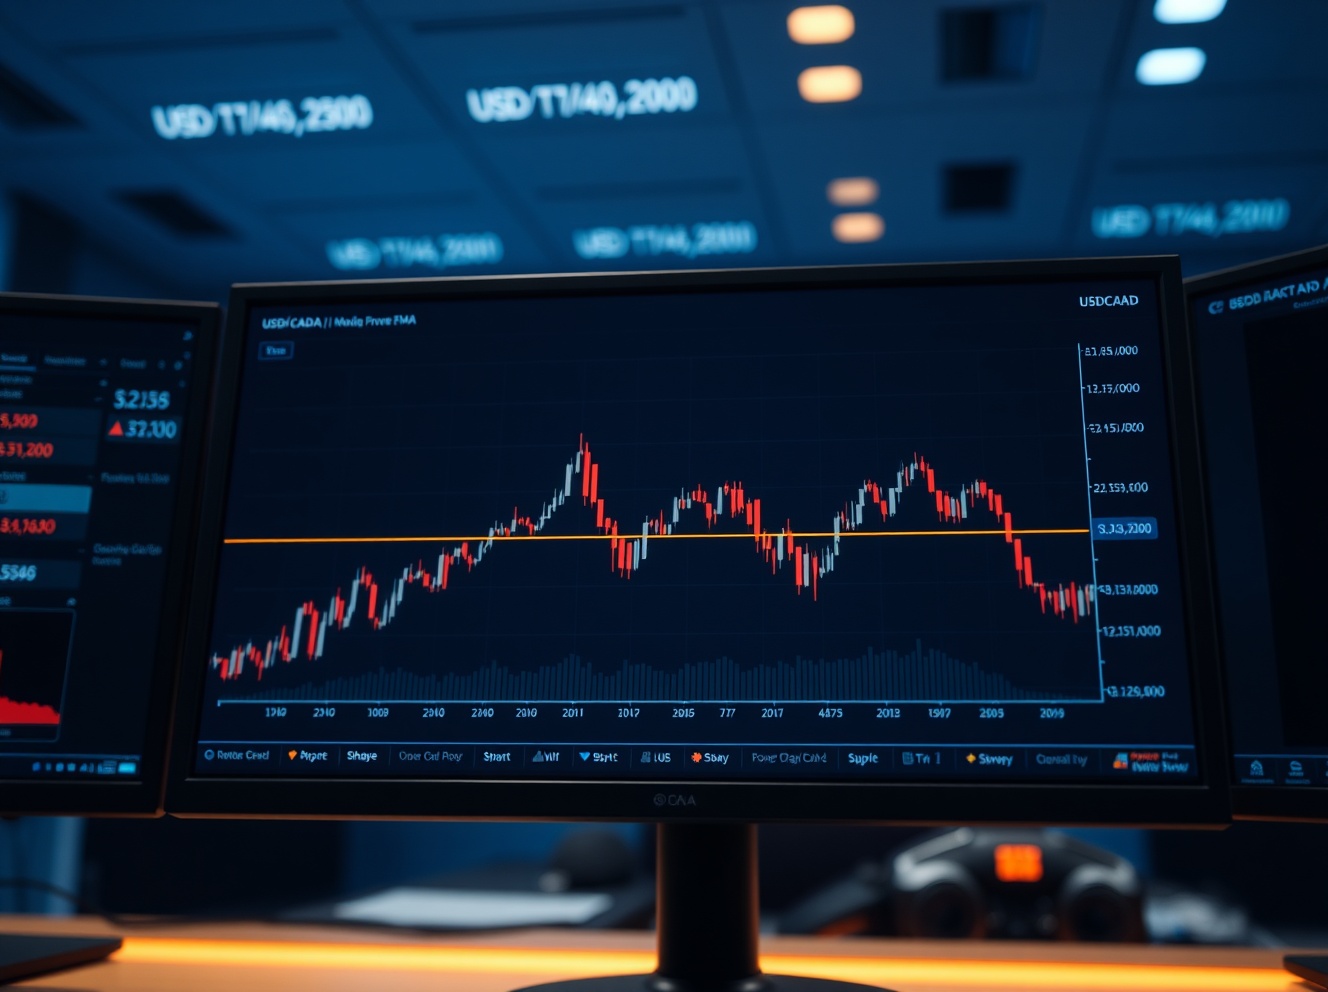
Image source: Shutterstock
Source: https://blockchain.news/news/20260115-price-prediction-trx-targets-032-035-by-february-as