Hyperliquid (HYPE) Price: Why This Token Gained 54% While the Market Dropped
TLDR
- Hyperliquid (HYPE) gained 54% in seven days and 27% in 24 hours while the broader crypto market struggled.
- Silver futures trading volume hit $1.25 billion on Hyperliquid in 24 hours, second only to Bitcoin and Ethereum.
- The platform routes 97% of trading fees into buybacks, creating demand for HYPE tokens as volume increases.
- HIP-3 open interest reached an all-time high of $790 million, up from $260 million a month ago.
- HYPE trades at $30.96 but remains 47% below its all-time high of $59.30 from September 2024.
Hyperliquid (HYPE) has emerged as one of the top-performing cryptocurrencies this week, posting gains that stand out against a struggling market. The token reached $30.96, marking a 27% increase in 24 hours and 54% growth over seven days.
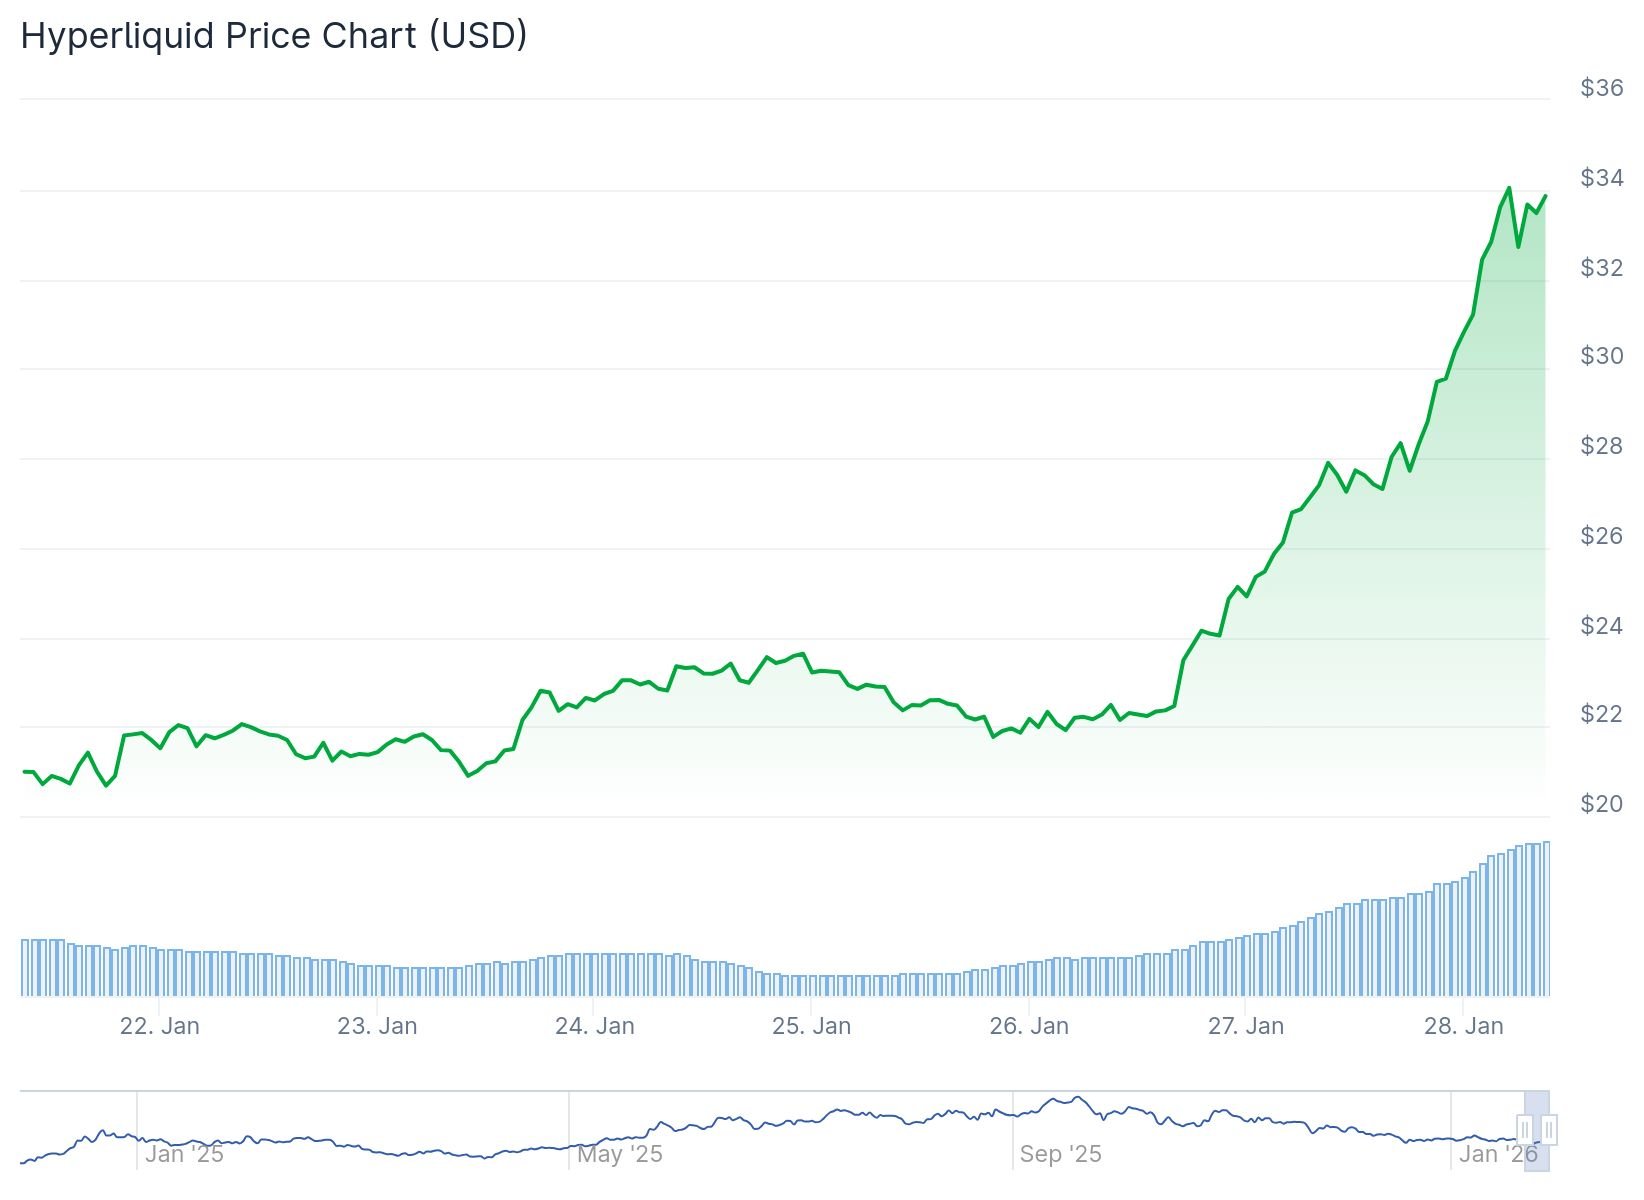 Hyperliquid (HYPE) Price
The rally comes during a period when most cryptocurrencies faced downward pressure. HYPE’s weekly gains exceeded 50%, while the total crypto market capitalization rose only about 4% during the same timeframe.
The surge in HYPE’s price connects directly to a spike in silver futures trading on the Hyperliquid platform. Silver perpetual contracts generated over $1.25 billion in trading volume within 24 hours. This volume placed silver as the third most-traded asset on the platform, behind only Bitcoin and Ethereum.
Traders rotated into the high-volatility commodity markets on Hyperliquid as broader markets remained cautious. This shift in trading activity drove substantial fee generation for the platform.
Hyperliquid operates with a unique fee structure that ties trading volume directly to token demand. The platform directs approximately 97% of trading fees into its Assistance Fund. This fund uses the collected fees to buy back HYPE tokens from the circulating supply.
Buyback Mechanism Drives Price Action
As trading volume increased, particularly from silver futures, the buyback mechanism accelerated. More HYPE tokens were purchased and removed from circulation, creating upward pressure on the price.
The platform’s HIP-3 markets saw open interest climb to an all-time high near $790 million. This represents a threefold increase from $260 million just one month earlier. The growth in open interest indicates traders are deploying larger position sizes on the protocol.
The general recovery in cryptocurrency markets after a weekend decline also supported HYPE’s upward momentum. The combination of increased trading activity and market recovery created favorable conditions for the token’s rally.
Technical Levels and Recent Performance
HYPE currently trades below its all-time high of $59.30, which the token reached in September 2024. The current price represents a 47% decline from that peak.
The token has posted gains across multiple timeframes. Over the past 14 days, HYPE increased 27.7%. Monthly gains stand at 25.8%, while the token is up 42.6% since the start of January 2025.
The daily RSI indicator shows momentum approaching overbought territory. The price is testing resistance at the 200-day exponential moving average and a Fibonacci retracement level. These technical factors suggest the rally may face near-term challenges.
If the current resistance holds, HYPE could pull back toward the 0.618 Fibonacci level near $28.82. A break above current levels could open the path toward $40-$48. CoinCodex analysts predict the price may drop to $23.28 by February 5, 2026.
Silver futures volume on Hyperliquid reached $1 billion in 24-hour trading, driving increased fee collection and token buybacks on the platform.
The post Hyperliquid (HYPE) Price: Why This Token Gained 54% While the Market Dropped appeared first on CoinCentral.


You May Also Like

XRP Coil Nears Snap While Breakdown Confirms Bearish Momentum

Trump biographer predicts next 3 Cabinet members on the chopping block