Cardano Price Prediction: ADA Defends $0.25 as $0.115 and $0.053 Emerge as Key Downside Levels
Cardano price is back at a pivotal technical zone as price revisits levels that previously marked the depth of the last bear market. After a prolonged downtrend and repeated failures to reclaim higher resistance zones, ADA Cardano price is now trading near $0.25–$0.27 as per Brave New Coin price data, placing it directly on a historically significant support area that has influenced major trend shifts in past cycles.
Weekly Chart Highlights Long-Term Demand Under Pressure
On the weekly timeframe, ADA is pressing into a multi-year trendline support region that dates back to the 2022 bear market lows. The trendline support sits broadly between the $0.24 and $0.27 levels. Price is currently hovering just above this band, making it a structurally important region for now.
Cardano’s ADA tests a critical multi-year trendline support, with the $0.24–$0.27 zone emerging as a key long-term decision area. Source: Sssebi via X
A longer-term scenario shared by Sssebi frames this zone as a potential pivot if 2026 turns into a constructive year for broader crypto markets. While the structure does not imply immediate upside, it does suggest that downside momentum may begin to compress as long as $0.24 holds on a weekly closing basis. Below this, the next major historical supports come in near $0.115 and $0.053, levels highlighted during prior cycle lows.
From a risk perspective, this region functions as a clear decision zone. Sustained consolidation above $0.25–$0.27 could allow ADA to stabilize and gradually build before gradually targeting $0.50, $1.00 and higher.
Key Support Levels to Watch
Further reinforcing the importance of the current zone, a separate weekly chart shared by Ali Charts identifies three major support levels for Cardano:
- $0.249 – immediate support and current area of interaction
- $0.115 – next historical demand if the current level fails
- $0.053 – extreme downside support tied to prior cycle capitulation
The repeated retest at the $0.25 level highlights just how important this level has become. Historically, repeated tests on a support eventually make it weaker.
Cardano price is testing a key horizontal support at $0.25 support. Source: Ali Charts via X
Oversold Conditions Emerge on Long-Term Momentum Indicators
Momentum indicators on the weekly chart add another layer to the analysis. ADA’s RSI has slipped into deeply oversold territory, with some analysts noting that Cardano has rarely, if ever, been this oversold on a weekly basis throughout its trading history.
ADA’s weekly RSI is deeply oversold. Source: Sssebi via X
While oversold conditions do not guarantee a reversal, they often signal that selling pressure is becoming increasingly inefficient. In previous cycles, similar conditions tended to align with periods of reduced downside follow-through, even if price continued to range before any meaningful recovery.
Market Context: Caution Remains, but Risk-Reward Is Shifting
Despite the technical importance of the current zone, sentiment around Cardano (ADA) remains fragile. Volume has tapered off, participation is down, and broader risk appetite across altcoins continues to stay selective.
These conditions increase the likelihood of false signals and extended consolidation, a dynamic that has also been visible across correlated crypto assets. That said, ADA is no longer trading in technical “no-man’s land.” From a structural perspective, price is now sitting at levels where longer-term market participants typically reassess downside risk rather than aggressively chase weakness.
Recent macro commentary adds further context. The CEO of Strategy Inc stated that Bitcoin would need to fall towards $8,000 before balance-sheet stress becomes an issue, highlighting the depth of downside buffers for institutional holders tied to $BTC and $MSTR.
Final Thoughts: Where Does Cardano Go From Here?
Cardano’s price action is now defined less by momentum and more by location, shaping the current Cardano price prediction around key historical levels. The $0.25–$0.27 zone represents a long-term inflection point rather than a short-term trade setup. Holding this region keeps the door open for base-building, with any recovery attempts likely needing a reclaim of $0.32–$0.35 first, followed by heavier resistance near $0.54, where prior range supply sits.
Cardano price is trading around $0.25, down -10.01% in the last 24 hours. Source: Brave New Coin
A sustained breakdown below $0.24 on a weekly close would materially weaken the structure and shift focus towards much lower historical supports. In that scenario, attention would move to $0.115, followed by the deeper cycle support near $0.053.


You May Also Like
Solana Strengthens RWA Presence With Explosive Growth In Value
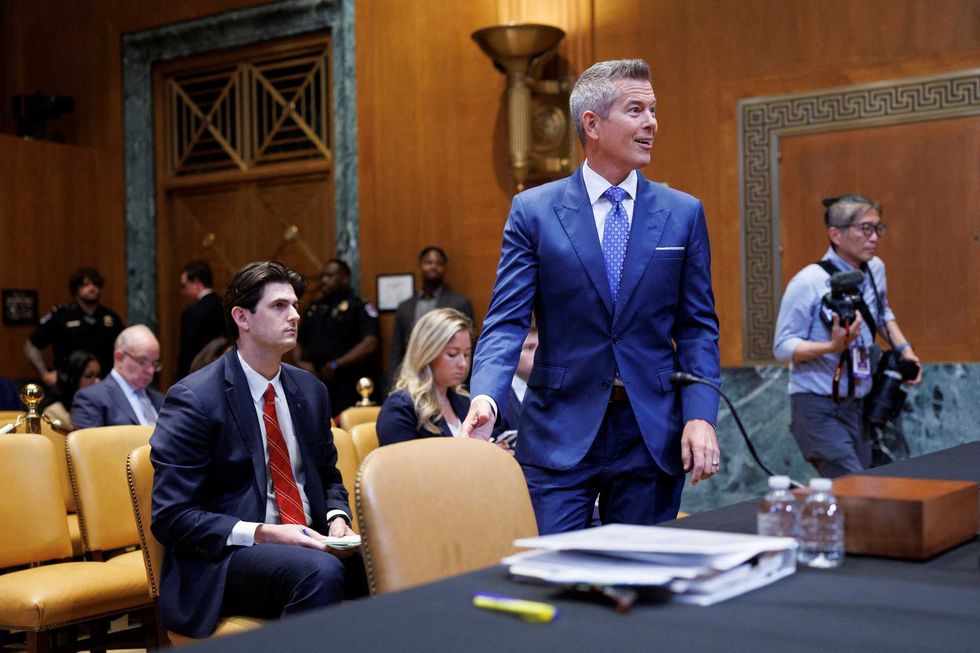
'You are wasting my time': Senator loses patience as Sean Duffy retorts 'Welcome to MAGA'