

Tron Crypto Today: TRXUSDT Walking a Tightrope Near Key Daily Support

The broader crypto market is gripped by extreme fear, and this backdrop is shaping Tron crypto today as TRXUSDT tests a delicate equilibrium around a key daily pivot.
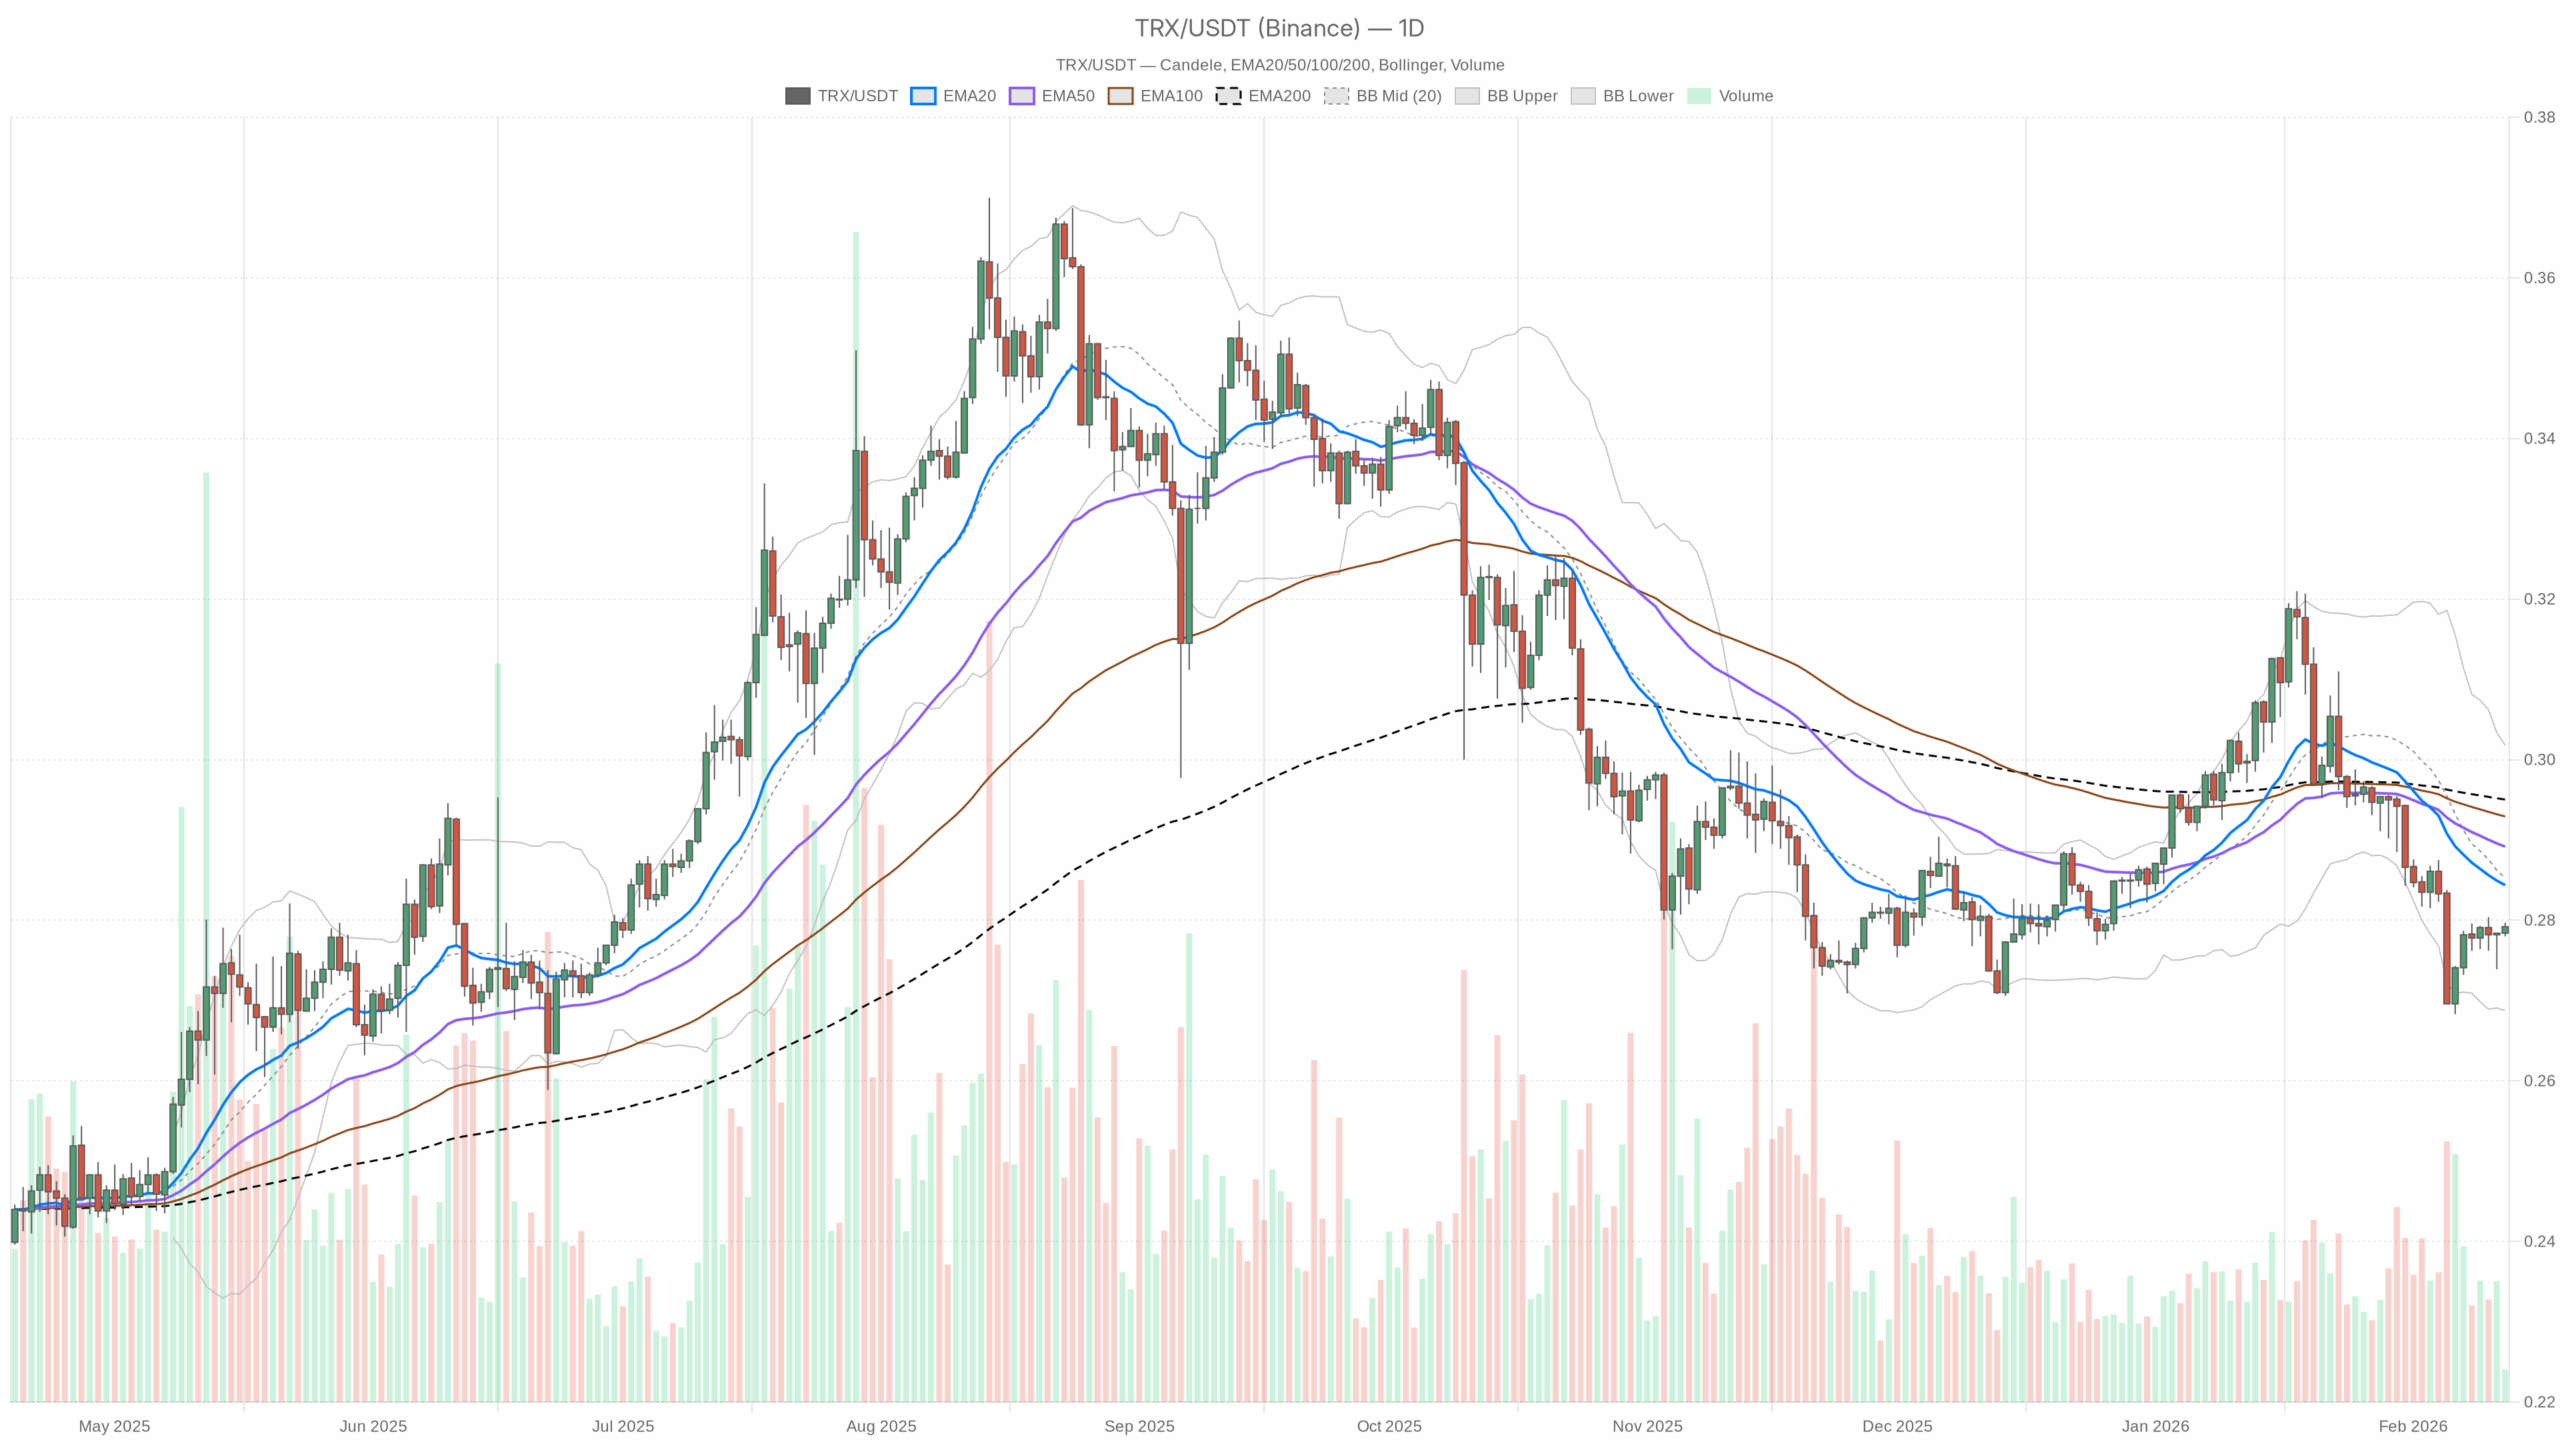 TRX/USDT — daily chart with candlesticks, EMA20/EMA50 and volume.
Tron crypto today: where TRXUSDT really stands
Tron (TRXUSDT) today is pinned around $0.28, sitting right on its daily pivot with the broader crypto market in extreme fear and Bitcoin still dominating over 56% of total cap. In other words, this is not a euphoric bounce – it is a market trying to decide whether the recent washout is done or only halfway through.
On the daily chart, TRX is still in a bearish regime, trading below its key moving averages and under mild downside pressure. Short-term intraday action (1H and 15m) shows some recovery and constructive momentum, but that is happening inside a larger, tired downtrend. This is what late-stage corrections often look like: price stabilises, volatility compresses, and then the next leg – up or down – becomes explosive.
Right now, the dominant force is not Tron-specific news, it is macro crypto risk sentiment. With fear at extremes and funds still flowing into ETFs despite a broader selloff, any shift in Bitcoin‘s tone will spill straight into TRX. Tron also remains a meaningful player in DeFi via SUNSwap, but that activity mostly speaks to network stickiness, not immediate price direction.
Main scenario from the daily chart: still bearish, but losing momentum
The daily timeframe (D1) sets the macro bias, and it is bearish:
- Price: $0.28, below the 50- and 200-day EMAs and hugging the lower half of its Bollinger structure.
- Momentum: weak but not capitulatory, suggesting more of a grinding downtrend than a panic crash.
However, this bearish bias is softening. Intraday timeframes are starting to lean bullish while the daily shows early signs of exhaustion rather than fresh aggression from sellers. That tension is exactly what you want to pay attention to over the next few sessions.
Daily timeframe (D1): structure, trend, and key levels
EMAs (trend structure)
- Price: $0.28
- EMA 20: $0.28
- EMA 50: $0.29
- EMA 200: $0.30
Price is stuck right on the 20-day EMA while still below the 50 and 200. The short-term mean has caught up with price, but the medium- and long-term trend remain above and declining.
In plain terms, the sharp part of the drop seems to have cooled off, but the broader trend is still down. Bulls are no longer getting steamrolled, but they are not in control either. For the trend to genuinely flip, TRX needs to push back above the 50-day EMA (around $0.29) and hold there. Otherwise this is just another pause in a larger downtrend.
RSI 14 (momentum)
- RSI (14-day): 40.63
Daily RSI hanging around 40 tells you this is weak, but not oversold. Sellers have the upper hand, but they are not pressing hard enough to create a classic rubber-band oversold bounce.
Practically, that means two things:
- There is room for another leg down before genuine exhaustion kicks in.
- Any bounce from here is more likely a technical mean-reversion than the start of a full-blown trend reversal, unless it is backed by a meaningful shift in structure with higher highs and higher lows on daily.
MACD (trend momentum)
- MACD line: -0.01
- Signal line: 0.00
- Histogram: ~0.00 (flat)
Daily MACD is slightly negative and effectively flat. That is what a market looks like after a decent trend move that has lost energy but has not reversed yet.
This kind of MACD behaviour usually means:
- The prior bearish impulse is cooling, not accelerating.
- The market is in decision mode: either base and turn, or roll over again from a lower volatility state.
You do not have a clean buy or sell trigger here. It is background confirmation that the dominant downtrend is tired, but still intact.
Bollinger Bands (volatility and positioning)
- Middle band (20-day basis): $0.29
- Upper band: $0.30
- Lower band: $0.27
- Price: $0.28 (between mid and lower band, but nearer the lower half of the range)
Tron is trading in the lower half of its daily Bollinger envelope with bands relatively tight. Volatility has compressed after the selloff; price is not hugging the lower band, but it is far from reclaiming the midline.
This typically precedes one of two outcomes:
- A volatility expansion lower if sellers reassert and push TRX back toward $0.27 and below.
- A relief squeeze toward the middle or upper band (roughly $0.29–0.30) if buyers can defend this congestion zone.
The key takeaway is that this is a coil, not a trend day. The next expansion in volatility is where the real opportunity appears, while direction still needs confirmation.
ATR 14 (risk and volatility)
- ATR (14-day): $0.01
A daily ATR around $0.01 on a $0.28 asset means typical swings are in the 3–4% intraday range. That is relatively calm by crypto standards.
For traders, this implies two things:
- Position sizing cannot be lazy, as a 3–4% daily move can still knock out tight stops quite easily.
- If ATR starts to spike from here while price breaks the range ($0.27–0.30), expect fast follow-through in whichever direction wins.
Daily pivot levels
- Pivot point (PP): $0.28
- R1: $0.28
- S1: $0.28
The automated pivots are essentially flat at $0.28, which is where price is trading. That tells you the market is right on a short-term equilibrium level, a balance point between buyers and sellers.
In practical trading terms, that means moves away from $0.28 that hold and build volume will matter far more than usual. Whichever side wins this tug-of-war around the pivot is likely to define the next 5–10% swing.
Intraday picture: 1H neutral, 15m leaning bullish
1-hour chart (H1): early recovery, but not a trend yet
- Price: $0.28
- EMA 20 / 50 / 200: all clustered around $0.28
- RSI (14-hour): 64.42
- MACD: flat around 0
- Bollinger mid / upper / lower: $0.28 / $0.28 / $0.27
- ATR (14-hour): ~0 (extremely low short-term volatility)
- Regime: Neutral
On H1, all key EMAs are stacked on top of each other at the same price, which is classic short-term balance. The recent intraday move has pulled RSI up into the 60s, indicating that bulls have had the momentum over the last several hours.
However, with MACD flat and ATR essentially zero, this is less a strong uptrend and more a gentle drift higher inside a tight range. Price is coiling intraday just as it is on the daily, but with a slightly bullish tilt.
15-minute chart (M15): execution context
- Price: $0.28
- EMA 20 / 50 / 200: all around $0.28
- RSI (14-period): 57.35
- MACD: flat near 0
- Bollinger bands: essentially collapsed at $0.28
- Regime: Bullish
The 15-minute chart is labelled bullish, but the reality is more nuanced. Price is grinding upward inside a very tight band, not exploding. RSI in the high-50s supports that story, as momentum is positive but not euphoric.
For execution, this timeframe suggests that shorting blindly into $0.28 without confirmation is risky, but chasing here also offers limited edge until volatility reappears.
Market context: fear, dominance, and Tron’s niche
- BTC dominance: about 56.6% – capital is hiding in Bitcoin and majors; altcoin beta like TRX will move with risk appetite swings.
- Total crypto market cap: roughly $2.37T, up modestly in 24 hours – a mild recovery, not a roaring bull.
- Fear and Greed Index: 5 – Extreme Fear. This usually appears nearer the late stages of a selloff, but it does not mark the exact bottom by itself.
- DeFi on Tron (SUNSwap): strong fee base, recent one-day fee spikes on SUNSwap V2 and V3. This shows ongoing on-chain activity and trading interest, which is supportive structurally, but it does not override macro risk flows.
Put together, Tron is not collapsing in isolation. It is trading as part of a risk-off, fear-dominated crypto environment with some stabilisation showing up. That makes it more vulnerable to another leg down if Bitcoin wobbles again, but it also means any broad crypto relief rally should see Tron participate.
Scenarios for Tron crypto today
Bullish scenario for TRXUSDT
The bullish path from here is a mean-reversion and then trend-repair story.
What the bulls want to see:
- Hold the $0.27–0.28 area on daily closes.
- This zone is near the lower Bollinger band and the current pivot. Losing it decisively would re-energise the bearish trend.
- Push price back above the daily middle Bollinger band and EMA 50 (around $0.29) and sustain it.
- A daily close above $0.29, with RSI pushing back toward 50–55 and MACD flattening toward zero or crossing up, would signal that the correction is transitioning into a base.
- Volatility expansion to the upside.
- ATR cannot stay this low forever. A rising ATR coupled with higher highs and higher lows intraday would suggest fresh participation on the buy side, rather than just passive short covering.
If this bullish script plays out, a reasonable first upside area lies around $0.30–0.31, where the upper daily Bollinger band and 200-day EMA zone are clustered. That is where the larger downtrend will be properly tested.
What would invalidate the bullish case?
- A decisive daily close below $0.27, accompanied by RSI slipping toward the low-30s and MACD turning more negative. That would confirm the current pause was just a bear flag and open up room for a deeper slide.
Bearish scenario for TRXUSDT
The bearish scenario leans on the fact that the daily regime is still down and the market is gripped by extreme fear.
What the bears are looking for:
- Failure to reclaim $0.29.
- If Tron repeatedly rejects the EMA 20 and 50 zone and the middle Bollinger band (roughly $0.28–0.29), the bounce is more likely just mean-reversion inside a continuing downtrend.
- Breakdown from the current tight range.
- A push below $0.27 with an uptick in ATR and selling volume would signal the start of a new volatility leg lower.
- Momentum staying weak.
- Daily RSI staying pinned in the 35–45 zone during new lows is classic grinding bear behaviour. MACD staying south of zero and widening further would add weight to this.
In that case, the market could probe substantially lower levels, with downside air pockets forming because price has been so tightly coiled. Exact targets would depend on historical support zones not contained in this dataset. Structurally, another 5–10% down from here would be entirely in character for this setup.
What would invalidate the bearish case?
- A clean daily reclaim and hold above $0.29–0.30, with the 20-day EMA crossing back toward the 50-day from below and RSI stabilising above 50. That would say the downtrend is no longer the path of least resistance.
Neutral or range-bound scenario
There is also a realistic middle path, where TRX chops sideways between $0.27 and $0.30 while the broader crypto market digests macro news and ETF flows.
- Low ATR and flat MACD on daily already point toward a range-trading environment.
- Intraday timeframes being mildly bullish inside a bearish daily context often translates into a sideways grind rather than an immediate reversal or breakdown.
This scenario favours short-term traders who are comfortable fading edges of the range and punishes directional over-confidence.
How to think about positioning in Tron crypto today
TRXUSDT right now is at a decision point rather than a clear trend phase. The daily chart is still pointing down, but shorter timeframes are leaning constructive, and volatility has been crushed. In these conditions, the balance of evidence matters.
Directional conviction should be conditional on how price behaves around the $0.27–0.29 zone. Moreover, volatility is likely to expand from here; whether that becomes a relief rally or another leg of the downtrend depends on the next break from this tight coil.
Risk is not gone just because candles are smaller. In fact, compressed ranges alongside extreme fear often precede the largest moves. For traders in Tron crypto today, the key is to respect the bearish daily bias while being open to the idea that a base might be forming, and to let the next expansion in price and ATR confirm which story the market chooses.


You May Also Like

Arthur Hayes Sees 20x Upside For NEAR, 5x For Zcash Within One Year

Mouse and GXChain to Offer Seamless Blockchain Access for TON Gaming Community

Russell Index Additions: SharpLink, Bitmine, and Galaxy Digital Gain Major Benchmark Status


