

Bitcoin Lacks Broad Participation as Key Metrics Signal Incomplete Reset
 The imbalance in buyer concentration becomes obvious once the January accumulation figures are matched against current derivatives positioning.
Strategy acquired 40,150 BTC during the month, representing 97.5% of all active DAT buying volume, while aggregate participation elsewhere continued to thin.
According to a recent assessment by CryptoQuant, the correction phase appears structurally unfinished. Spot order flow, derivatives exposure, miner positioning, and valuation metrics are not yet aligned with prior macro cycle bottoms.
Buyer Concentration Raises Structural Concerns
The scale of accumulation by Strategy, led by Michael Saylor, stands out not for its size alone, but for its relative dominance. Accounting for nearly all measurable DAT buying volume, Strategy’s purchases occurred while Spot CVD printed persistent red bars.
Cumulative Volume Delta reflects the balance between aggressive buyers and sellers. When large red bars dominate while a single entity absorbs supply, it signals that broader market demand is not expanding. Instead, distribution is occurring into a concentrated bid.
Historically, this type of hand-off can indicate structural fragility. Sustainable bottoms tend to form when participation broadens rather than narrows.
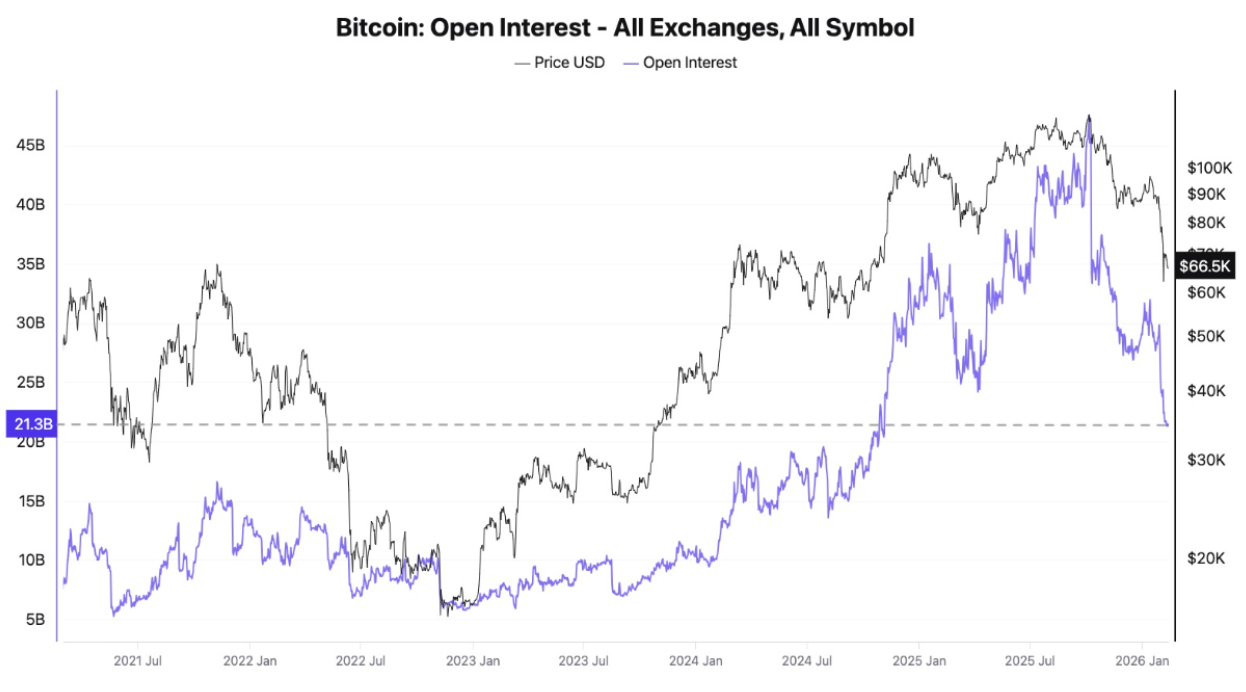
Futures Open Interest Signals Momentum Vacuum
Futures Open Interest has compressed to $21.3 billion, marking a yearly low.
Such contraction typically reflects leveraged traders exiting positions rather than positioning for expansion. In prior cycle transitions, durable bottoms often form after leverage has fully reset and begins rebuilding with conviction. At present, the decline in OI suggests deleveraging without yet signaling renewed directional commitment.
Momentum, therefore, remains muted rather than rebuilding.
Miner Distribution and Valuation Context
Miner behavior adds another layer of pressure. Large-scale operators began trimming positions after February 9th, contributing incremental supply into a market already lacking broad demand. While miner flows do not dictate price direction independently, sustained distribution during weak participation phases can extend corrective structures.
The MVRV ratio currently stands near 1.2. Historically, macro cycle lows have formed closer to the 0.7–0.8 region. If historical compression bands were to repeat proportionally, that framework would imply additional downside potential before valuation reaches long-term accumulation zones.
That said, as market depth and institutional participation evolve, historical bottom bands have shown signs of gradually rising over successive cycles. This nuance tempers direct one-to-one comparisons with prior drawdowns.
Structural Outlook
The alignment of metrics, concentrated spot accumulation, suppressed Open Interest at $21.3B, ongoing miner distribution, and an MVRV ratio above historical macro-bottom thresholds, does not yet resemble the broad capitulation and reaccumulation patterns typically associated with durable cycle lows.
None of these indicators guarantee further downside, but collectively they suggest that structural repair is incomplete. A more convincing bottom would likely require expanding spot participation, stabilization in miner flows, and evidence of positive spot CVD alongside rebuilding derivatives exposure.
For now, the data implies caution rather than confirmation.
The post Bitcoin Lacks Broad Participation as Key Metrics Signal Incomplete Reset appeared first on ETHNews.
You May Also Like

Maximizing Energy Efficiency with Proper New Window Installation

XRP Gains Institutional Boost: Citi Adoption Could Drive Price Toward $3
