

Nexo (NEXO) Price Prediction 2026, 2027-2030
- Bullish NEXO price prediction for 2026 is $1.037 to $1.587.
- Nexo (NEXO) price might reach $5 soon.
- Bearish NEXO price prediction for 2026 is $0.417.
In this Nexo (NEXO) price prediction 2026, 2027-2030, we will analyze the price patterns of NEXO by using accurate trader-friendly technical analysis indicators and predict the future movement of the cryptocurrency.
|
TABLE OF CONTENTS
|
|
INTRODUCTION
|
|
|
NEXO PRICE PREDICTION 2026
|
|
| NEXO PRICE PREDICTION 2027, 2028-2030 |
| CONCLUSION |
| FAQ |
NEXO (NEXO) Current Market Status
| Current Price | $0.9077 |
| 24 – Hour Price Change | 7.78% Up |
| 24 – Hour Trading Volume | $22.13M |
| Market Cap | $586.7M |
| Circulating Supply | 646.14M NEXO |
| All – Time High | $4.63 (On Nov 16, 2021) |
| All – Time Low | $0.04333(On Sep 12, 2018) |
What is Nexo (NEXO)
| TICKER | NEXO |
| BLOCKCHAIN | Ethereum |
| CATEGORY | Centralized Finance |
| LAUNCHED ON | April 2018 |
| UTILITIES | Crypto loans, Interest, Exchange, Rewards, & Dividends |
Nexo is a blockchain-based platform that offers cryptocurrency-backed loans, allowing users to borrow against their digital assets without selling them. Launched in 2018, Nexo provides services such as instant credit lines, high-yield savings accounts, and an exchange for trading various cryptocurrencies. The platform supports assets like Bitcoin, Ethereum, and stablecoins, enabling users to earn interest or access credit with competitive rates.
Nexo’s proprietary token, NEXO, offers benefits such as higher interest rates, fee discounts, and dividends from company profits. The platform is regulated and ensures security through insured custodial solutions. Nexo’s mission is to bridge traditional finance with decentralized finance (DeFi), offering flexible financial solutions tailored to crypto holders. With a strong compliance framework and global presence, Nexo continues to expand its suite of services to meet the evolving needs of the digital asset economy.
Nexo 24H Technicals
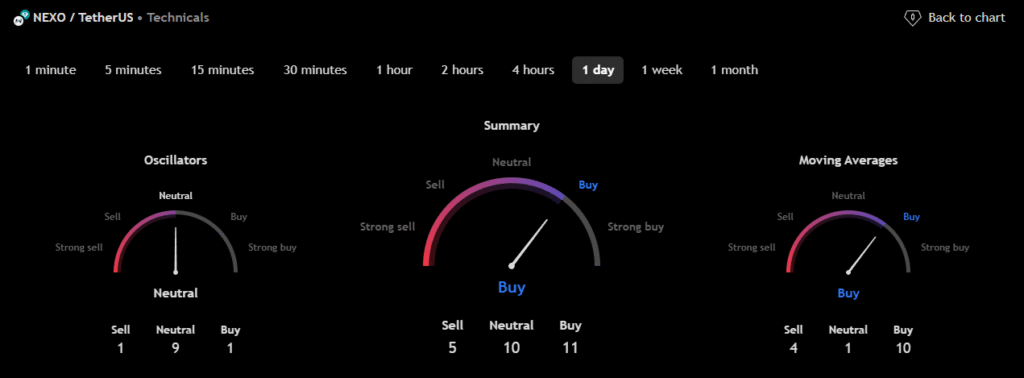 (Source: TradingView)
Nexo (NEXO) Price Prediction 2026
Nexo (NEXO) ranks 73rd on CoinMarketCap in terms of its market capitalization. The overview of the Nexo price prediction for 2026 is explained below with a daily time frame.
In the above chart, Nexo (NEXO) laid out an Ascending Triangle pattern. The ascending triangle is a characteristic pattern of an ongoing bullish trend. This triangle is formed by a horizontal upper trendline that connects the highs, indicating a consistent level of resistance, and a lower trendline that connects the rising lows, reflecting increasing buying pressure.
As the price approaches the apex of the triangle, the tension between buyers and sellers intensifies. If the trend breaks out at the resistance level, the price will continue to move up in this ascending triangle pattern, often leading to further gains. Traders typically look for confirmation of the breakout, which can enhance the likelihood of a successful upward move.
At the time of analysis, the price of Nexo (NEXO) was $0.9077. If the pattern trend continues, then the price of NEXO might reach the resistance levels of $0.982 and $1.579. If the trend reverses, then the price of NEXO may fall to the support of $0.823 and $0.611.
Nexo (NEXO) Resistance and Support Levels
The chart given below elucidates the possible resistance and support levels of Nexo (NEXO) in 2026.
From the above chart, we can analyze and identify the following as resistance and support levels of Nexo (NEXO) for 2026.
| Resistance Level 1 | $1.037 |
| Resistance Level 2 | $1.587 |
| Support Level 1 | $0.609 |
| Support Level 2 | $0.417 |
NEXO Resistance & Support Levels
Nexo (NEXO) Price Prediction 2026 — RVOL, MA, and RSI
The technical analysis indicators, such as Relative Volume (RVOL), Moving Average (MA), and Relative Strength Index (RSI) of Bitcoin (NEXO), are shown in the chart below.
From the readings on the chart above, we can make the following inferences regarding the current Nexo (NEXO) market in 2026.
| INDICATOR | PURPOSE | READING | INFERENCE |
| 50-Day Moving Average (50MA) | Nature of the current trend by comparing the average price over 50 days | 50 MA = $0.898Price = $0.889 (50MA > Price) |
Bearish/Downtrend |
| Relative Strength Index (RSI) | Magnitude of price change;Analyzing oversold & overbought conditions | 54.332 <30 = Oversold 50-70 = Neutral>70 = Overbought |
Neutral |
| Relative Volume (RVOL) | Asset’s trading volume in relation to its recent average volumes | Below cutoff line | Weak volume |
Nexo (NEXO) Price Prediction 2026 — ADX, RVI
In the below chart, we analyze the strength and volatility of Nexo (NEXO) using the following technical analysis indicators — Average Directional Index (ADX) and Relative Volatility Index (RVI).
From the readings on the chart above, we can make the following inferences regarding the price momentum of Nexo (NEXO).
| INDICATOR | PURPOSE | READING | INFERENCE |
| Average Directional Index (ADX) | Strength of the trend momentum | 43.277 | Strong Trend |
| Relative Volatility Index (RVI) | Volatility over a specific period | 57.93 <50 = Low >50 = High |
High volatility |
Comparison of NEXO with BTC, ETH
Let us now compare the price movements of Nexo (NEXO) with those of Bitcoin (BTC) and Ethereum (ETH).
From the above chart, we can interpret that the price action of NEXO is similar to that of BTC and ETH. That is, when the price of BTC and ETH increases or decreases, the price of NEXO also increases or decreases, respectively.
Nexo (NEXO) Price Prediction 2027, 2028 – 2030
With the help of the aforementioned technical analysis indicators and trend patterns, let us predict the price of Nexo (NEXO) between 2027, 2028, 2029, and 2030.
| Year | Bullish Price | Bearish Price |
| Nexo (NEXO) Price Prediction 2027 | $7 | $0.3 |
| Nexo (NEXO) Price Prediction 2028 | $9 | $0.2 |
| Nexo (NEXO) Price Prediction 2029 | $11 | $0.1 |
| Nexo (NEXO) Price Prediction 2030 | $13 | $0.09 |
Conclusion
If Nexo (NEXO) establishes itself as a good investment in 2026, this year would be favorable to the cryptocurrency. In conclusion, the bullish Nexo (NEXO) price prediction for 2026 is $1.587. Comparatively, if unfavorable sentiment is triggered, the bearish Nexo (NEXO) price prediction for 2026 is $0.417.
If the market momentum and investors’ sentiment positively elevates, then Nexo (NEXO) might hit $5. Furthermore, with future upgrades and advancements in the Nexo ecosystem, NEXO might surpass its current all-time high (ATH) of $4.63 and mark its new ATH.
FAQ
1. What is Nexo (NEXO)?
Nexo is a blockchain-based platform that offers cryptocurrency-backed loans, allowing users to borrow against their digital assets without selling them.
2. Where can you purchase Nexo (NEXO)?
Nexo (NEXO) has been listed on many crypto exchanges which include Binnace, Nexo Exchange, Bitstamp, Huobi, Bitfinex, Gate.io, Bitget, MEXC Global, Uniswap and CoinEx.
3. Will Nexo (NEXO) reach a new ATH soon?
With the ongoing developments and upgrades within the Nexo Platform, NEXO has a high possibility of reaching its ATH soon.
4. What is the current all-time high (ATH) of Nexo (NEXO)?
On Nov 16, 2021, Nexo (NEXO) reached its new all-time high (ATH) of $4.63.
5. What is the lowest price of Nexo (NEXO)?
According to CoinMarketCap, NEXO hit its all-time low (ATL) of $0.04333, on Sep 12, 2018.
6. Will Nexo (NEXO) reach $5?
If Nexo (NEXO) becomes one of the active cryptocurrencies that maintains a bullish trend, it might rally to hit $5 soon.
7. What will be Nexo (NEXO) price by 2026?
Nexo (NEXO) price is expected to reach $7 by 2026.
8. What will be Nexo (NEXO) price by 2027?
Nexo (NEXO) price is expected to reach $9 by 2027.
9. What will be Nexo (NEXO) price by 2028?
Nexo (NEXO) price is expected to reach $11 by 2028.
10. What will be Nexo (NEXO) price by 2029?
Nexo (NEXO) price is expected to reach $13 by 2029.
Top Crypto Predictions
BOOK OF MEME (BOME) Price Prediction
NEAR Protocol (NEAR) Price Prediction
Cronos (CRO) Price Prediction
Disclaimer: The opinion expressed in this chart is solely the author’s. It does not represent any investment advice. TheNewsCrypto team encourages all to do their own research before investing.


You May Also Like

Cathie Wood’s ARK Invest Buys $13.7M in Circle Shares While Selling Robinhood Stock

Metaplanet buys 5,075 Bitcoin in Q1 to become 3rd-largest treasury

The changing face of elder care in Malaysia — Sayed Mohammad Reza Yamani Sayed Umar


