

As of February 4, 2026, Solana (SOL) has decisively broken below the psychological $100 support level, marking its lowest price point in nearly a year.As of February 4, 2026, Solana (SOL) has decisively broken below the psychological $100 support level, marking its lowest price point in nearly a year.
Solana Crash Below $100 Triggers Massive Long Liquidations
For feedback or concerns regarding this content, please contact us at crypto.news@mexc.com
Solana Price Analysis: The Anatomy of a Crash
The current price action os $Solana reveals a stark technical shift: what was once a rock-solid floor has now become a formidable ceiling.
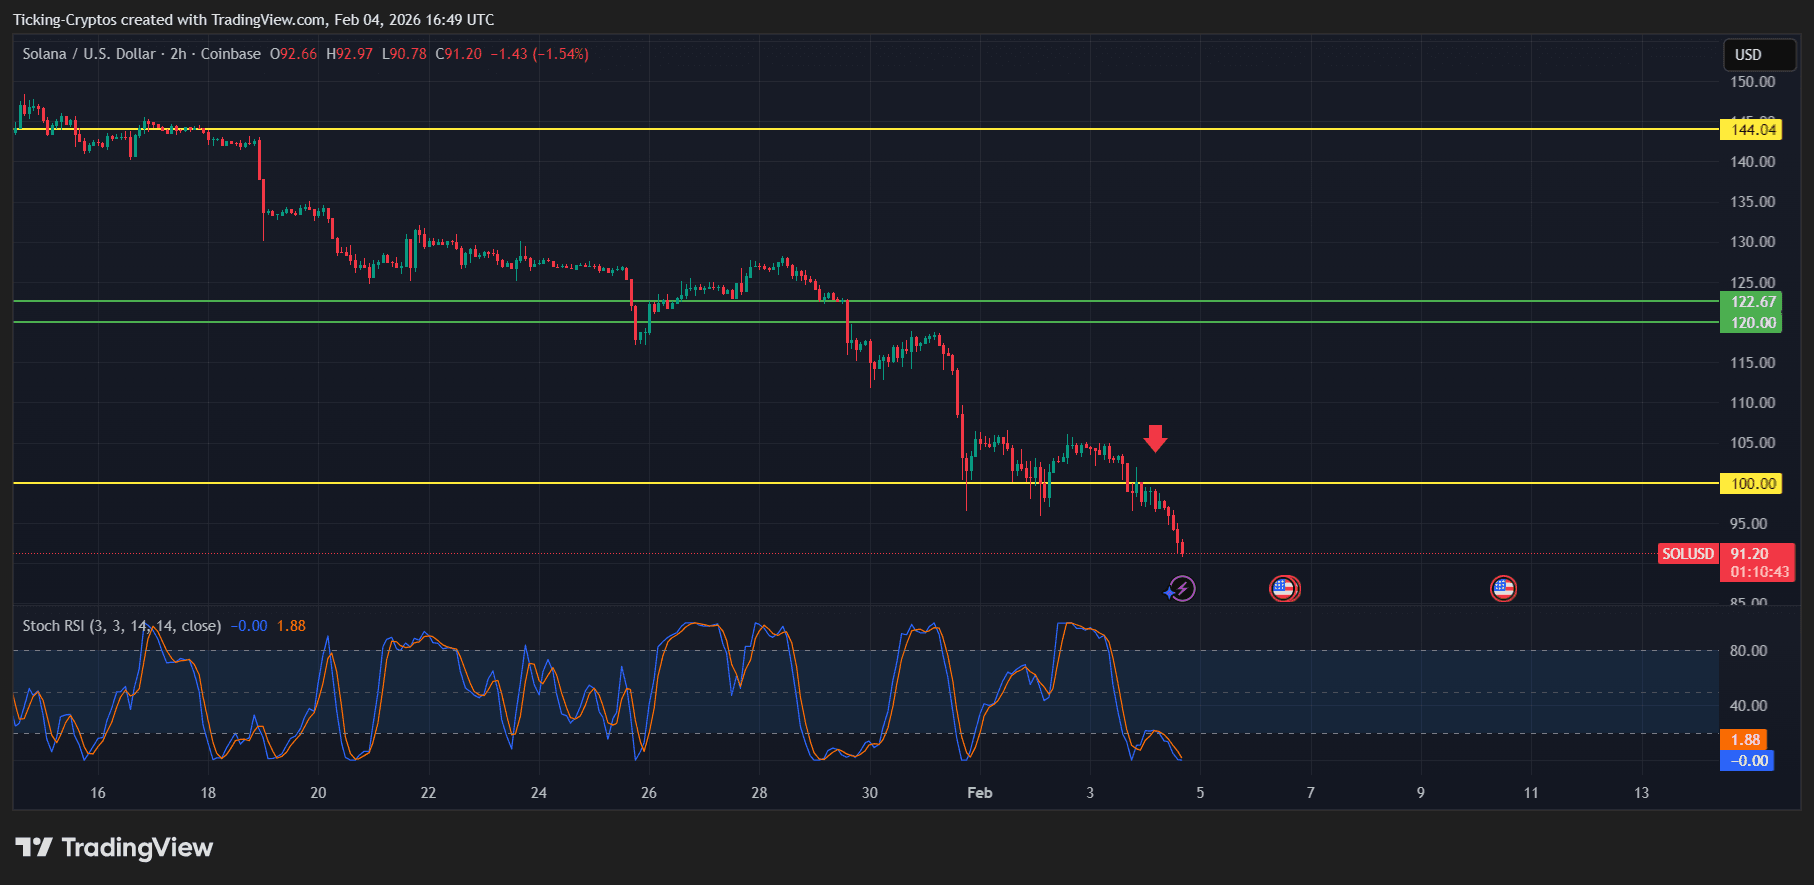
- The Breakdown: After failing to sustain momentum near the $118–$120 supply zone in late January, SOL entered a freefall. The 2-hour chart shows the price currently fighting to stabilize near $95.72 after dipping as low as $93.38.
- Negative Funding Trap: Market sentiment is currently at an extreme. Data shows the OI-weighted funding rate has turned negative (roughly -0.0057%), meaning short-sellers are so aggressive they are actually paying long-holders to keep their bearish bets open.
- Oversold Signals: On the 2-hour timeframe, the Stochastic RSI is buried at 6.38, deep in oversold territory. While this suggests the selling pressure is reaching a point of exhaustion, any relief bounce will face immediate and heavy resistance at the $100.30 and $106.53 levels.
 SOL/USD 2H - TradingView
Why did Solaba Crash below $100
This crash isn't happening in a vacuum; it’s the result of a "perfect storm" of macro and ecosystem factors:
- Macro "Risk-Off" Sentiment: Broader markets are under heavy pressure, with Bitcoin sliding toward $75,000. The Crypto Fear & Greed Index has plunged to 14 ("Extreme Fear"), dragging high-beta assets like SOL down faster than the market average.
- ETF Outflows: For the first time since their high-profile launch, Solana spot ETFs recorded weekly net outflows of $2.45 million, signaling that institutional "smart money" is moving to the sidelines.
- Leverage Flush: The breach of $100 acted as a "tripwire." Of the total liquidations, nearly $24.7 million were long positions, creating a sell-side feedback loop that accelerated the drop to $93.
- On-Chain Divergence: Ironically, network usage is surging. Solana is currently processing over 3,700 TPS with a TVL of $9.3 billion. However, the market is currently ignoring these fundamentals in favor of liquidating over-leveraged traders.
Solana Price Prediction: Where Does the Slide Stop?
With $SOL struggling to maintain its footing in the mid-90s, the market is looking for a macro bottom.
Downside Targets (Bearish)
- Immediate Support: $90.00 - $92.00. This is the primary weekly demand zone. If this fails to hold on a daily close, the "crash" narrative will likely intensify.
- Macro Floor: $78.93. This represents the January 2024 trough. Analysts warn that a failure at $90 opens the door for a 20% slide to this final line of defense.
Upside Targets (Recovery)
- Target 1: $106.53. Reclaiming this level (the 20-day EMA) is the first step to proving the crash was a "bear trap."
- Target 2: $122.67. A break above this resistance would be required to declare the trend officially reversed.
Market Opportunity
Belong Price(LONG)
$0.0007326
$0.0007326$0.0007326
USD
Belong (LONG) Live Price Chart


Disclaimer: The articles reposted on this site are sourced from public platforms and are provided for informational purposes only. They do not necessarily reflect the views of MEXC. All rights remain with the original authors. If you believe any content infringes on third-party rights, please contact crypto.news@mexc.com for removal. MEXC makes no guarantees regarding the accuracy, completeness, or timeliness of the content and is not responsible for any actions taken based on the information provided. The content does not constitute financial, legal, or other professional advice, nor should it be considered a recommendation or endorsement by MEXC.
You May Also Like

Fed’s Hammack Warns Inflation Could Force Action ‘Soon’
BitcoinWorld Fed’s Hammack Warns Inflation Could Force Action ‘Soon’ Federal Reserve Bank of Cleveland President Beth Hammack issued a notable warning on Tuesday
Share
bitcoinworld2026/06/03 08:35

One Of Frank Sinatra’s Most Famous Albums Is Back In The Spotlight
The post One Of Frank Sinatra’s Most Famous Albums Is Back In The Spotlight appeared on BitcoinEthereumNews.com. Frank Sinatra’s The World We Knew returns to the Jazz Albums and Traditional Jazz Albums charts, showing continued demand for his timeless music. Frank Sinatra performs on his TV special Frank Sinatra: A Man and his Music Bettmann Archive These days on the Billboard charts, Frank Sinatra’s music can always be found on the jazz-specific rankings. While the art he created when he was still working was pop at the time, and later classified as traditional pop, there is no such list for the latter format in America, and so his throwback projects and cuts appear on jazz lists instead. It’s on those charts where Sinatra rebounds this week, and one of his popular projects returns not to one, but two tallies at the same time, helping him increase the total amount of real estate he owns at the moment. Frank Sinatra’s The World We Knew Returns Sinatra’s The World We Knew is a top performer again, if only on the jazz lists. That set rebounds to No. 15 on the Traditional Jazz Albums chart and comes in at No. 20 on the all-encompassing Jazz Albums ranking after not appearing on either roster just last frame. The World We Knew’s All-Time Highs The World We Knew returns close to its all-time peak on both of those rosters. Sinatra’s classic has peaked at No. 11 on the Traditional Jazz Albums chart, just missing out on becoming another top 10 for the crooner. The set climbed all the way to No. 15 on the Jazz Albums tally and has now spent just under two months on the rosters. Frank Sinatra’s Album With Classic Hits Sinatra released The World We Knew in the summer of 1967. The title track, which on the album is actually known as “The World We Knew (Over and…
Share
BitcoinEthereumNews2025/09/18 00:02
Cango Inc. Closes $75M in Capital Deals to Fund AI and Bitcoin Mining Expansion
TLDR: Cango Inc. raised $65M from leadership, issuing 49.2M shares settled in USDT on March 31, 2026. DL Holdings received a $10M convertible note and warrants
Share
Blockonomi2026/04/02 18:51


