

XRP Price Under Pressure: Bears in Control, But Selling Looks Tired

The current crypto environment is risk-off, and the XRP price reflects that mood with a controlled drift lower rather than a panic move.
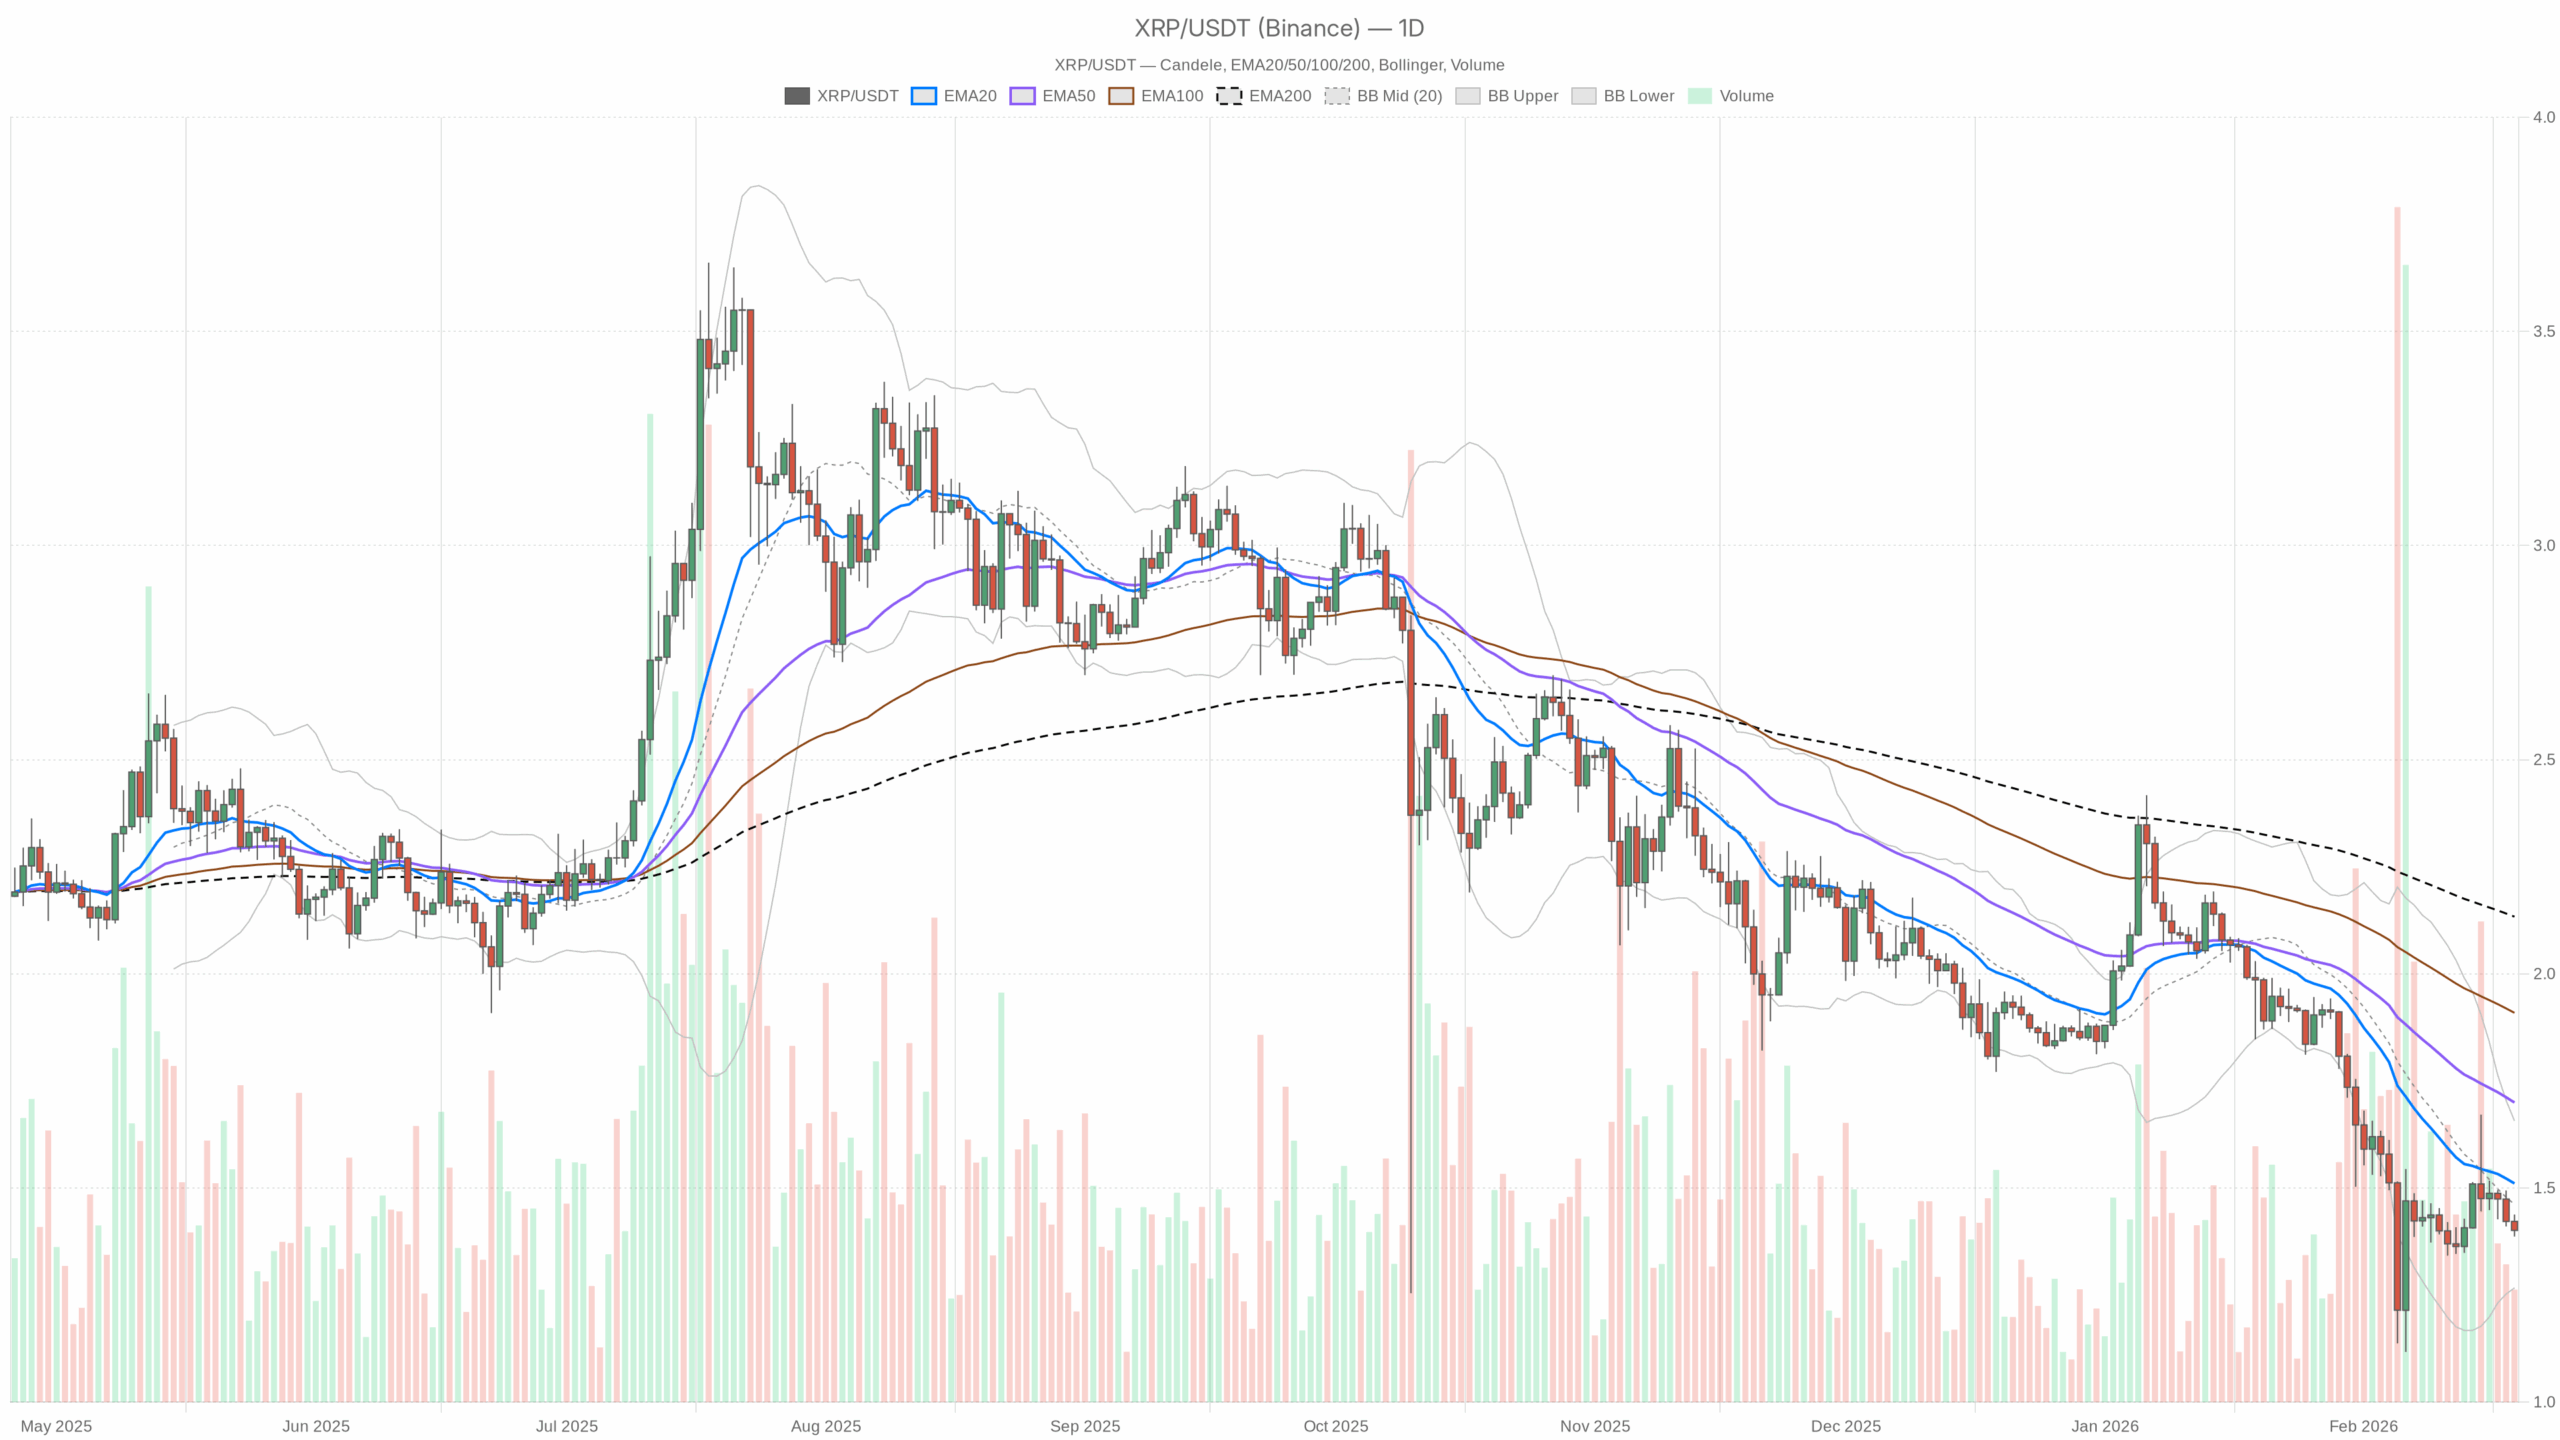 XRP/USDT — daily chart with candlesticks, EMA20/EMA50 and volume.
Market Thesis: XRP Price in a Controlled Descent, Not a Panic Dump
XRPUSDT is trading around $1.40, sitting below all the key daily moving averages and under the Bollinger mid-band. The higher timeframe structure is clearly bearish, but this is not a crash; it is a grind lower in a broader risk-off crypto environment.
Total crypto market cap is down about 1.8% over 24 hours, BTC dominance is elevated at ~56%, and the Fear & Greed Index is stuck in Extreme Fear (9). Capital is hiding in Bitcoin and stables, and altcoins like XRP are feeling the weight. However, the dominant force right now is defensive positioning, not speculative appetite.
On XRP specifically, the daily trend is down, momentum is weak, yet volatility is relatively contained. That cocktail usually favors controlled stair-steps lower rather than explosive moves in either direction, until a catalyst or a clear technical break appears.
Daily Timeframe (D1): Macro Bias = Bearish
On the daily chart, XRP is in a textbook downtrend that has been developing over time rather than erupting suddenly.
Trend Structure: EMAs
EMA20: 1.51 | EMA50: 1.70 | EMA200: 2.13 | Price (close): 1.40
Price is trading below all three EMAs, and they are stacked bearishly (20 < 50 < 200). That is a mature downtrend, not just a pullback. Being below the 20-day in particular means short-term sellers still control the tape; there is no sign of a real reclaim yet.
Momentum: RSI (14)
RSI14: 37.82
RSI is below 40, so momentum is bearish, but it is not deeply oversold. Sellers are in charge, but they are not maxed out. That leaves room for further downside without requiring an immediate relief rally. Yet it also hints that forced selling is not extreme at this stage.
Momentum Confirmation: MACD
MACD line: -0.10 | Signal: -0.12 | Histogram: 0.02
MACD is negative, aligning with the downtrend, but the line is slightly above the signal, hence the small positive histogram. That is a mild momentum stabilisation: the downside push is slowing rather than accelerating. Bears are still in control, but the pressure is easing a bit instead of snowballing.
Volatility and Range: Bollinger Bands & ATR
Bollinger Bands (20): Mid 1.46 | Upper 1.66 | Lower 1.27
ATR(14): 0.11
Price sits below the middle band but not pinned to the lower band. That is a controlled downtrend rather than a waterfall. There is still room to the downside (toward ~1.27) if selling picks up, but current positioning shows more of a slow drift than outright panic. ATR at 0.11 means daily swings of roughly 8% are normal right now, elevated enough to hurt overleveraged positions, but not extreme for XRP.
Short-Term Levels: Daily Pivot
Pivot Point (PP): 1.41 | R1: 1.43 | S1: 1.38
Price is sitting right under the daily pivot at 1.41. That keeps intraday bias slightly negative. As long as XRP holds below 1.41–1.43, rallies are more likely to be sold into than extended. First nearby support is around 1.38; losing that opens up a deeper test lower in the daily Bollinger range.
Daily takeaway: The main scenario is bearish. Trend, structure, and momentum lean down. The only nuance is that the selloff is controlled, not capitulatory, which shapes expectations for follow-through.
Hourly Timeframe (H1): Weak Bounces in a Bearish Channel
On the 1H chart, XRP is grinding sideways to lower, echoing the daily bias but with even less energy showing up in the candles.
Trend: EMAs (H1)
EMA20: 1.42 | EMA50: 1.44 | EMA200: 1.45 | Price: 1.40
Price is under all key intraday EMAs, and those averages are clustered just above: 1.42–1.45 is a dense resistance zone. Each time price tries to bounce, it runs into this overhead supply. Intraday buyers are losing the fight at the averages, which reinforces the short-term bearish tone.
Momentum: RSI & MACD (H1)
RSI14: 36.41
MACD line: -0.01 | Signal: -0.01 | Histogram: 0.00
RSI on the hourly is weak but not washed out, again around the high 30s. This mirrors the daily: persistent selling, no real sign of exhaustion. MACD is flat and negative, showing a lack of strong intraday impulse in either direction. Sellers are pushing price lower through grind, not aggression or panic.
Range & Intraday Pivot (H1)
Bollinger Bands (H1): Mid 1.42 | Upper 1.44 | Lower 1.40
ATR(14): 0.01
Pivot (H1 PP): 1.40 | R1: 1.41 | S1: 1.39
Price hugs the lower hourly band and sits right on the intraday pivot at 1.40. That signals a tight, low-volatility drift lower. With ATR at just 0.01, the hourly moves are small and controlled. Scalpers are trading a compressed range around 1.39–1.41. A decisive break below 1.39 would likely expand that range to the downside.
Hourly takeaway: H1 confirms the bearish daily bias, but in a slow bleed rather than a dump. Any bounce into 1.42–1.45 remains suspect unless price can close and hold above that band on multiple hourly candles.
15-Minute (M15): Execution Context, Not a Trend Reversal
On M15, XRP is just chopping near the lows of the broader range, offering more noise than signal for bigger-picture direction.
Short-Term Structure: EMAs (M15)
EMA20: 1.41 | EMA50: 1.42 | EMA200: 1.44 | Price: 1.40
The same pattern repeats: price is below all short-term EMAs, which are stepping down. The micro-structure is aligned with the higher timeframes. There is no hidden bullish divergence in trend here that would justify a strong reversal call.
Short-Term Momentum & Volatility (M15)
RSI14: 42.78
MACD: Line -0.01 | Signal -0.01 | Histogram 0.00
Bollinger Bands (M15): Mid 1.41 | Upper 1.42 | Lower 1.39
Pivot (M15 PP): 1.40 | R1 1.41 | S1 1.39
ATR(14): 0.01
RSI on M15 is slightly higher than on H1, in the low 40s, hinting at mild intraday dip-buying or at least some stabilization. But MACD is flat, and price sits near the lower band and near S1 at 1.39–1.40. For execution, this timeframe shows short, tradable bounces from 1.39–1.40 into 1.41–1.42, but nothing that challenges the broader bearish structure.
15m takeaway: Micro bounces are possible, but the lower-timeframe action is just noise inside a larger downtrend and should be treated as such by higher timeframe traders.
Market Regime and Cross-Timeframe View
Across D1, H1, and M15, the regime flags are all explicitly bearish. There is no timeframe showing a clear bullish shift yet or a durable change in structure.
- Trend: All key EMAs above price on every timeframe → bears control structure.
- Momentum: RSI below 50 across the board, with daily and hourly sitting in the 30s → persistent selling, not oversold panic.
- Volatility: ATR is moderate on D1 and compressed on intraday → controlled drift, not capitulation.
- Macro context: BTC dominance high, extreme fear in the broader market → altcoins are in the penalty box and struggle to attract new inflows.
The only mild tension is between the slowing downside momentum (MACD histogram on D1 slightly positive) and the still-bearish price structure. In plain terms, the downtrend is aging, but it has not actually reversed or even properly challenged the dominant sellers yet.
Key Levels for XRP Price
Key technical zones continue to define the battleground where bulls and bears are likely to react.
- Immediate resistance: 1.41–1.43 (daily PP and R1, plus intraday resistance)
- Short-term resistance band: 1.42–1.45 (cluster of H1/M15 EMAs and hourly Bollinger mid)
- Stronger resistance: 1.51 (daily EMA20) and 1.66 (daily upper Bollinger)
- Immediate support: 1.38 (daily S1) and 1.39 (intraday S1)
- Deeper support zone: 1.30–1.27 (daily lower Bollinger band region)
Scenario Map for XRP Price
Bullish Scenario
For a meaningful bullish case, XRP needs more than a scalp bounce; it needs to start reclaiming structure step by step on multiple timeframes.
What a constructive bullish path looks like:
- Hold above 1.38–1.39 on closing basis (H1/D1). This confirms buyers are defending current support.
- Break and hold above 1.41–1.43, turning the daily pivot band from resistance into support.
- Reclaim the 1.42–1.45 EMA cluster on H1 with RSI moving back above 50. That would show that intraday control is shifting from sellers to buyers.
- Daily close back above the EMA20 (~1.51). That is the key line where the daily downtrend starts to be questioned. Above there, rallies toward 1.60–1.66 (upper Bollinger) become realistic.
If this plays out, XRP could transition from a controlled downtrend into a mean-reversion rally, with shorts covering and new longs targeting the mid-1.60s region rather than new lows.
What invalidates the bullish scenario?
A decisive break below 1.38 on daily closing basis, with RSI staying below 40 and MACD turning more negative again, would put the bullish path on ice. That would show that the apparent stabilisation was just a pause before another leg down.
Bearish Scenario
The current setup already leans bearish, so continuation is the path of least resistance unless something shifts in structure or momentum.
What a continuation lower looks like:
- XRP fails to reclaim 1.41–1.43 and keeps closing below the daily pivot zone.
- Intraday, H1 and M15 EMAs continue to cap rallies in the 1.42–1.45 band, with RSI stuck sub-50.
- Price breaks below 1.38–1.39, expanding intraday volatility and dragging daily RSI closer to the low 30s.
- Selling extends toward the 1.30–1.27 area (daily lower Bollinger band and psychological zone), where a more meaningful oversold condition could finally form.
In this path, XRP grinds lower in legs, not in a straight line. Expect short, sharp bounces as shorts take profit, but with the broader direction still down until key resistance levels are convincingly reclaimed.
What invalidates the bearish scenario?
A sustained move back above 1.45, followed by a daily close over 1.51 (EMA20), would start to break the bearish narrative. If that move is backed by RSI reclaiming 50+ on both H1 and D1, the downtrend would be in doubt, and bears would have to reassess their positioning.
Positioning, Risk, and Uncertainty
The XRP price is in an established downtrend, in a market that is clearly risk-off, and in an environment of extreme fear. That combination usually rewards patience and disciplined level-by-level trading, not aggressive bets in either direction.
For directional traders, the important thing is timeframe alignment and respecting where structure actually changes:
- If you are trading the daily trend, the bias is down until price starts closing above 1.51 on a consistent basis.
- If you are trading intraday, your battlefield is roughly 1.38–1.45, with tight ranges and low ATR on the lower timeframes.
Volatility is moderate but can expand quickly if 1.38 breaks or if the broader market moves out of extreme fear. Uncertainty remains high: sentiment is fragile, and any macro or regulatory headline can flip the tape in either direction.
In summary, XRP is in a controlled bearish regime. The market is not pricing in a collapse, but it is also not willing to pay up for risk. Until the key levels outlined above are reclaimed or cleanly broken, treating this as a trend-following environment with respect for volatility and liquidity makes more sense than trying to call heroic tops or bottoms.
You May Also Like

Therap Services Announces 2027 National Conference in St. Louis, Missouri on February 9-11

The $1.68 Billion Strategic Reserve Defying Market Volatility

Susquehanna-backed Blockfills up for sale after $75 million lending loss
Copy linkX (Twitter)LinkedInFacebookEmail