Kaspa Price Prediction: $10M Short Squeeze Could Explode KAS Toward $0.035
Kaspa (KAS) is sitting in a tight range right now, and traders are watching because the next move could come fast. The price is hovering near the $0.029 area, with liquidity building both above and below the market.
Data shared byKaspa Daily shows two clear liquidity zones that could pull price in either direction. The first sits slightly below the current level around $0.029–$0.0285, while a larger cluster sits above near $0.031.
When markets get trapped between liquidity pools like this, price often moves toward whichever zone gets triggered first. That is why the current setup has many traders paying attention. However, derivatives data shows a major imbalance that could add fuel to the next move.
Liquidity Clusters Show Where KAS Price May Move Next
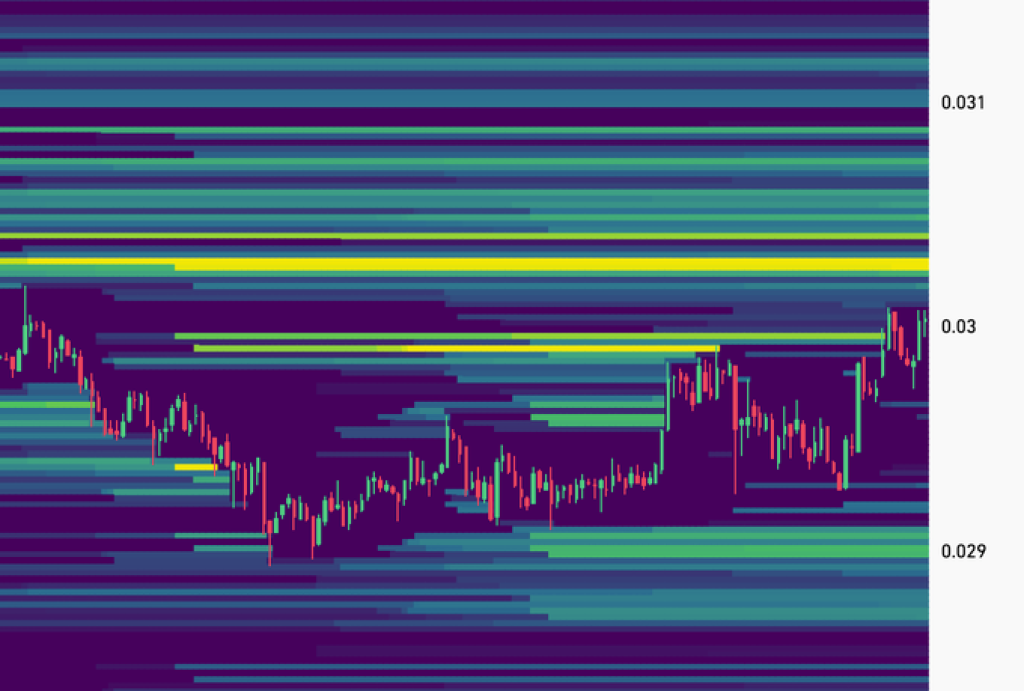
One of the charts shows a liquidity heatmap, which highlights where large orders are sitting in the order book.
The brightest bands on the chart appear above the current price, especially around the $0.0305–$0.031 range. These zones often act like magnets because price tends to move toward areas where liquidity is concentrated.
However, another liquidity pocket sits below the market around $0.029–$0.0285. If buyers lose control, the KAS price could briefly dip into that zone to collect liquidity before reversing.
Right now, Kaspa is essentially trapped between these two pools, which often leads to sudden moves once one side is taken.
 Source: X/KaspaDaily
Kaspa Liquidation Data Shows a Massive Imbalance
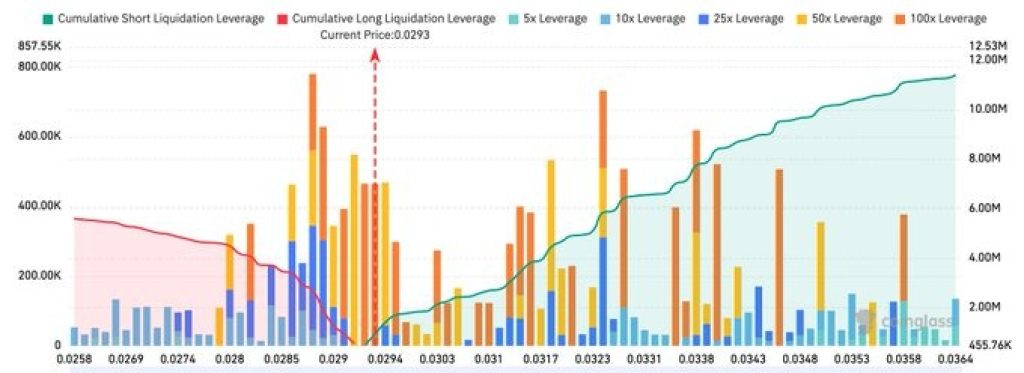
The second chart highlights something even more interesting: a major imbalance in the derivatives market.
According to liquidation data, about $10 million worth of short positions would be liquidated if Kaspa reaches $0.035.
On the other side, only around $400,000 in long positions would be liquidated if price drops to $0.0258.
That creates a 25x imbalance toward the upside. When markets see structures like this, price sometimes moves toward the side with the larger amount of potential liquidations.
If the Kaspa price starts pushing higher, those short positions could begin getting wiped out. That would force traders to buy back their positions, which adds more buying pressure. This type of chain reaction is known as a short squeeze.
Read Also: Oil Market Shock: Prices Collapse as G7 Considers 400M Barrel Release
 Source: X/KaspaDaily
What Could Happen Next For KAS Price
For now, the key support zone sits around $0.029–$0.0285. As long as that level holds, buyers still have a chance to push the market higher.
If the Kaspa price breaks above the $0.031 liquidity cluster, momentum could increase as the market starts targeting the next pool of liquidity.
The most important level above sits near $0.035. That is where roughly $10 million in short positions could be liquidated.
If the Kapsa price reaches that level, the resulting short squeeze could accelerate the move and push Kaspa higher very quickly.
For now, the charts show a market caught between two liquidity zones. The next breakout will likely decide whether Kaspa dips first toward support or triggers a squeeze toward $0.035.
Subscribe to our YouTube channel for daily crypto updates, market insights, and expert analysis.
The post Kaspa Price Prediction: $10M Short Squeeze Could Explode KAS Toward $0.035 appeared first on CaptainAltcoin.


You May Also Like

Analog Devices (ADI) Pursues $1.5 Billion Acquisition of Empower Semiconductor

Why Businesses Need Professional Machine Design and Development Services