

Ripple’s XRP Price Could Outperform Bitcoin if 0.000017 BTC Breaks
For many years, XRP has struggled to keep up with Bitcoin when measured against the BTC pair. However, a new analysis suggests the long period of underperformance may be approaching a turning point.
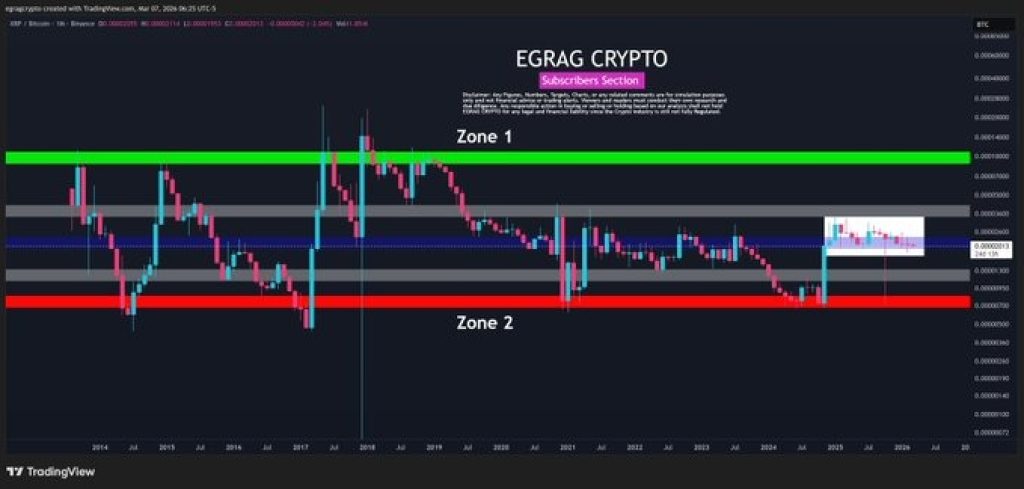
Top analyst Egrag Crypto showed a hidden liquidity cycle can be observed on the chart of the XRP/BTC pair, indicating when the XRP price will be able to gain strength in relation to the price of Bitcoin
In fact, the XRP/BTC pair has declined by 4.23% in the year 2025 so far, trading at 0.00002014 BTC. This is in line with an overall trend that has seen the XRP price find it hard to gain traction against the BTC.
Although there have been periods of high price action in terms of the dollar value of XRP, the asset has not been able to find traction against the BTC in the same period. As such, the XRP/BTC pair has been rather weak in recent times.
In fact, an overall look at the macro trends indicates that the recent performance of the pair is not necessarily random.
The 8-Year Liquidity Cycle
Egrag Crypto shared that the XRP/BTC pair appears to move within an eight-year macro liquidity cycle that divides the market into several key zones.
The chart highlights a green zone at the top of the range where the XRP price historically becomes highly extended against Bitcoin. At the opposite end sits a red zone that has repeatedly acted as a major undervaluation area for the pair.
Between these two extremes lies a broad gray range where the market tends to spend most of its time consolidating. Historically, XRP/BTC moves through these phases over several years before eventually transitioning into a new expansion phase.
What the XRPBTC Chart Shows Now
We took a look at the long-term chart structure, the XRP/BTC pair has already reached the lower end of the cycle and bounced back into the gray zone. Since that point, the price has been ranging while building a consolidation zone.
The price structure of the pair indicates that the pair is currently building liquidity in this zone.
The chart also shows that previous cycles followed a similar pattern where extended periods of sideways movement eventually led to a strong directional move.
At the moment, the XRP price remains within this gray range, which historically acts as a transition area between accumulation and expansion.
Read Also: ChatGPT Predicts Bittensor (TAO) Price if a Supply Crunch Hits While 68% of Tokens Are Staked
 Source: X/theCryptoBasic
Why 0.000017 BTC Matters FOR XRP
The analysis points out the importance of the 0.000017 BTC level, which may be a major point of resistance in the coming days. A breakthrough past this level will be a sign that XRP is finally gaining strength against Bitcoin.
Generally, similar moves in the XRP/BTC chart have marked the start of a period of time where capital is flowing from Bitcoin into XRP.
When this occurs, the XRP tends to perform better against the BTC pair while also showing greater price appreciation in dollar value.
For the time being, the market is consolidating in this area, but the price is being monitored as a possible trigger for a bigger move to come.
If the XRP price is able to break and hold above the 0.000017 BTC price threshold, it could be the start of a period where the asset is finally able to outperform the bitcoin price
Subscribe to our YouTube channel for daily crypto updates, market insights, and expert analysis.
The post Ripple’s XRP Price Could Outperform Bitcoin if 0.000017 BTC Breaks appeared first on CaptainAltcoin.


You May Also Like

Tom Lee and BitMine’s Latest Ethereum Purchase Faces Community Backlash

KuCoin Launches KuCard on Mastercard in Australia


