Solana (SOL) Upside Awakens — Will Bulls Finally Hit $100?
Solana started a fresh increase above the $88 zone. SOL price is now consolidating near $90 and might aim for more gains above the $92 zone.
- SOL price started a fresh upward move above the $85 and $88 levels against the US Dollar.
- The price is now trading above $88 and the 100-hourly simple moving average.
- There was a break above a key contracting triangle with resistance at $87 on the hourly chart of the SOL/USD pair (data source from Kraken).
- The pair could extend gains if it clears the $92 resistance zone.
Solana Price Regains Traction
Solana price started a decent increase after it settled above the $85 zone, like Bitcoin and Ethereum. SOL climbed above the $88 level to enter a short-term positive zone.
There was a break above a key contracting triangle with resistance at $87 on the hourly chart of the SOL/USD pair. The price even smashed the $90 resistance. A high was formed at $91.12, and the price is now consolidating gains. There was a minor decline below the 23.6% Fib retracement level of the recent upward move from the $85.09 swing low to the $91.12 high.
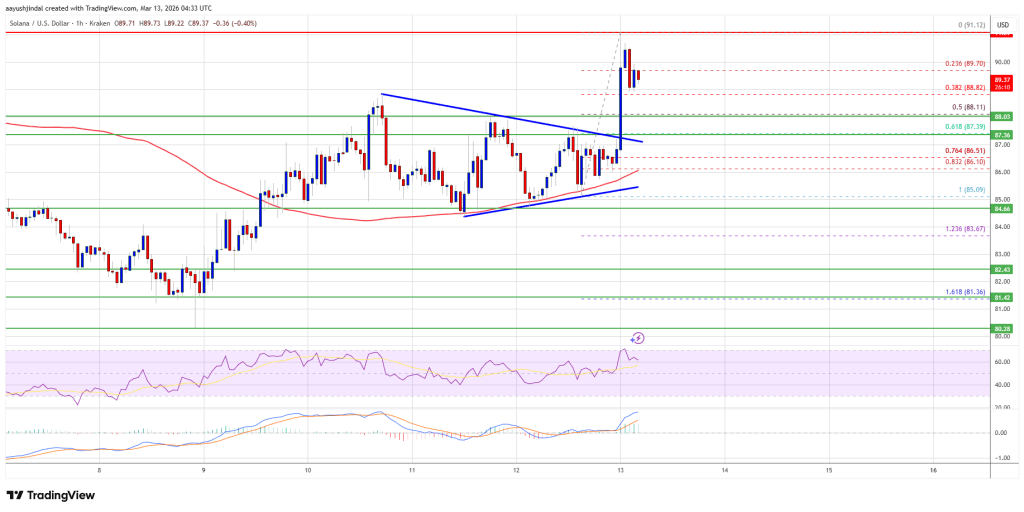
Solana is now trading above $88 and the 100-hourly simple moving average. On the upside, the price is facing resistance near $91.20. The next major resistance is near the $92 level. The main resistance could be $95. A successful close above the $95 resistance zone could set the pace for another steady increase. The next key resistance is $100. Any more gains might send the price toward the $102 level.
Downside Correction In SOL?
If SOL fails to rise above the $91.20 resistance, it could start another decline. Initial support on the downside is near the $88 zone. The first major support is near the $87.40 level and the 61.8% Fib retracement level of the recent upward move from the $85.09 swing low to the $91.12 high.
A break below the $87.40 level might send the price toward the $85 support zone. If there is a close below the $85 support, the price could decline toward the $78 support in the near term.
Technical Indicators
Hourly MACD – The MACD for SOL/USD is losing pace in the bullish zone.
Hourly Hours RSI (Relative Strength Index) – The RSI for SOL/USD is above the 50 level.
Major Support Levels – $88.00 and $87.40
Major Resistance Levels – $91.20 and $95.00.


You May Also Like

Fed Governor Calls For Strong Stablecoin Oversight As CLARITY Act’s Final Text Gets Delayed
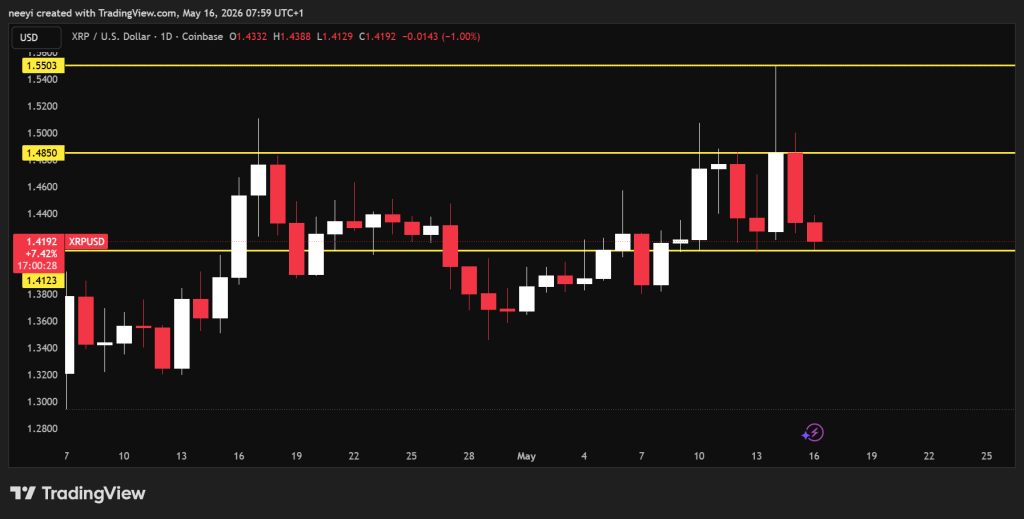
Crypto Price Prediction for Today, May 16: XRP, Solana (SOL), Ethereum (ETH)