SHIB Price Prediction: Neutral Zone Trading Suggests Consolidation Through April 2026
Rebeca Moen Mar 17, 2026 09:25
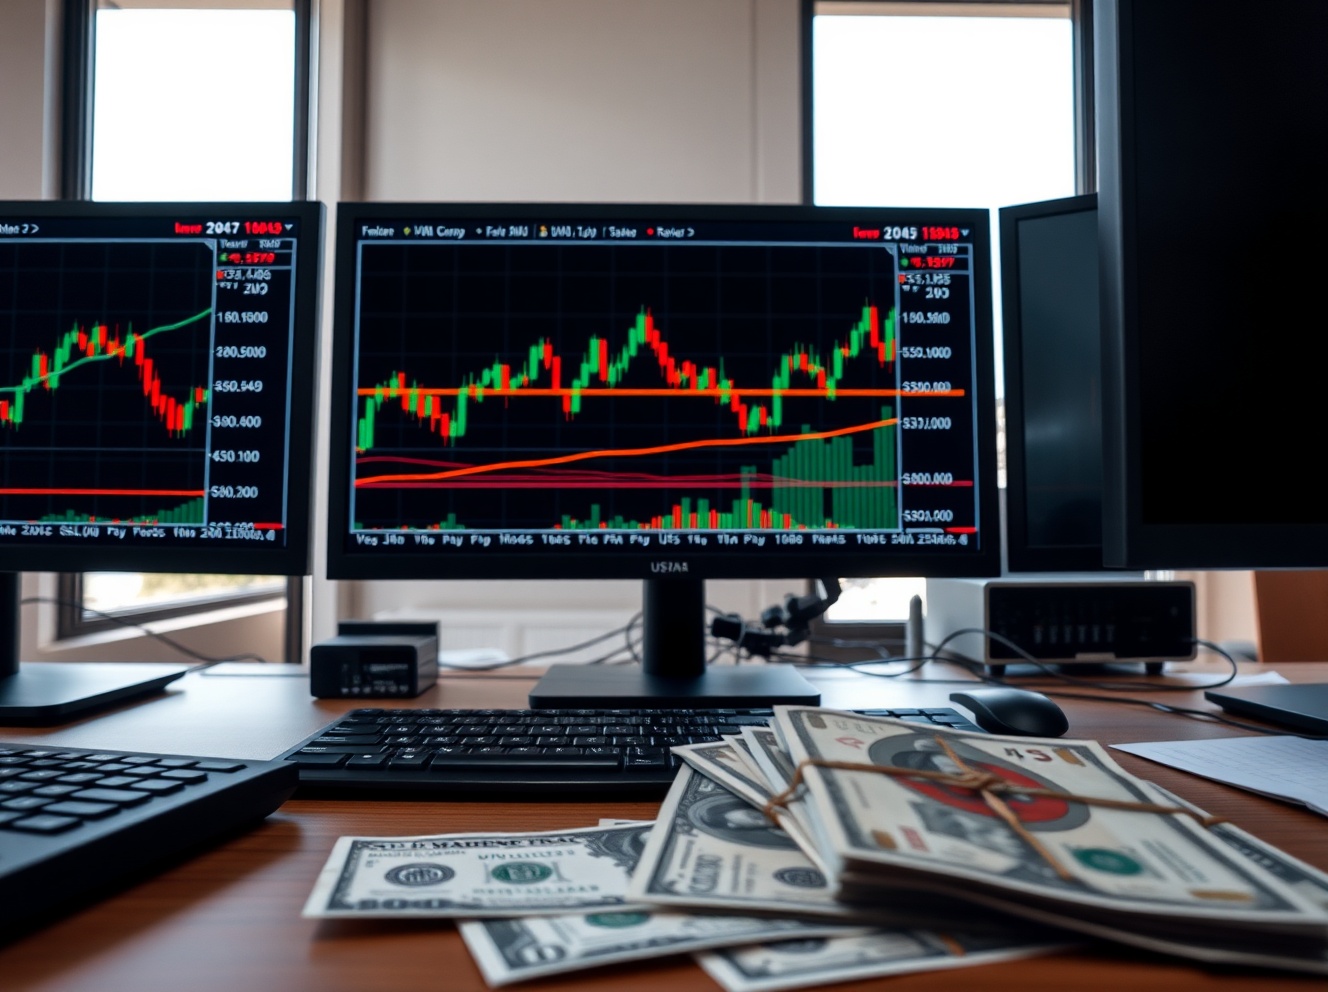
SHIB trades at $0.00000608 with RSI at 54.68 showing neutral momentum. Technical analysis points to sideways action with key resistance at upper Bollinger Band levels.

Shiba Inu (SHIB) continues to trade in a neutral technical zone as of March 17, 2026, with the meme coin showing mixed signals that suggest a period of consolidation ahead. Our comprehensive SHIB price prediction analysis reveals key levels that could determine the token's next major move.
SHIB Price Prediction Summary
• Short-term target (1 week): $0.0000055 - $0.0000065 range • Medium-term forecast (1 month): $0.0000050 - $0.0000070 consolidation zone • Bullish breakout level: Above $0.0000070 with volume confirmation • Critical support: $0.0000050 psychological level
What Crypto Analysts Are Saying About Shiba Inu
While specific analyst predictions are limited in recent weeks, the most recent professional forecast comes from Peter Zhang, who projected a target of $0.0000085 by the end of January 2026. However, SHIB has struggled to reach these levels, currently trading at $0.00000608.
According to on-chain data from major analytics platforms, SHIB's trading patterns suggest institutional interest remains subdued, with retail traders driving most of the current volume. The token's 24-hour trading volume of $8,740,109 on Binance indicates moderate but not exceptional interest from the crypto community.
SHIB Technical Analysis Breakdown
The current technical picture for Shiba Inu presents a mixed outlook. The RSI reading of 54.68 places SHIB firmly in neutral territory, suggesting neither overbought nor oversold conditions. This neutral RSI reading typically indicates that the asset could move in either direction based on external catalysts.
The MACD histogram shows a slightly bearish momentum with negative values, though the magnitude is minimal at -0.0000. This suggests that while selling pressure exists, it's not overwhelming and could easily reverse with positive market sentiment.
Perhaps most notably, SHIB's position within the Bollinger Bands shows the token trading at 0.8964 of the band width, placing it near the upper resistance level. This positioning often indicates that the asset is approaching overbought conditions and may face resistance at current levels.
The 24-hour price decline of 2.55% aligns with the slightly bearish technical indicators, though the magnitude suggests normal market volatility rather than a significant trend reversal.
Shiba Inu Price Targets: Bull vs Bear Case
Bullish Scenario
In a bullish scenario, SHIB would need to break above its current upper Bollinger Band resistance with significant volume. A successful breakout could target the $0.0000070 level, representing approximately 15% upside from current prices.
The bullish case would require RSI to push above 60 while maintaining momentum, coupled with MACD turning positive. Such technical confirmation would suggest renewed buying interest and could attract momentum traders back to SHIB.
For this Shiba Inu forecast to materialize, we'd need to see daily volume increase beyond the current $8.7 million level, ideally reaching $15-20 million to confirm genuine buying pressure.
Bearish Scenario
The bearish case centers around SHIB's current position near Bollinger Band resistance combined with negative MACD momentum. A rejection at current levels could send the token toward its lower support zones.
Immediate downside targets sit around $0.0000055, with more significant support expected at the $0.0000050 psychological level. A break below this critical support could open the door to further declines toward $0.0000045.
The risk factors include overall crypto market weakness, continued meme coin sector underperformance, and lack of significant ecosystem developments for the Shiba Inu project.
Should You Buy SHIB? Entry Strategy
Based on current technical conditions, a cautious approach appears warranted for SHIB. The token's position near Bollinger Band resistance suggests waiting for either a confirmed breakout or a pullback to better entry levels.
Conservative traders might consider entering on any dip toward $0.0000055-$0.0000060 range, with stop-losses placed below the $0.0000050 support level. This approach offers a favorable risk-reward ratio while protecting against significant downside.
More aggressive traders could consider small positions at current levels, but should implement tight stop-losses at $0.0000055 to limit potential losses if the bearish MACD momentum accelerates.
Position sizing should remain conservative given SHIB's high volatility profile and the current neutral technical setup that could resolve in either direction.
Conclusion
Our SHIB price prediction suggests a period of consolidation through April 2026, with the token likely to trade between $0.0000050 and $0.0000070. The neutral RSI and mixed technical signals indicate that external catalysts will likely determine SHIB's next significant move.
While the long-term outlook for meme coins remains speculative, SHIB's established position in the crypto ecosystem provides some stability. However, traders should remain cautious and employ proper risk management strategies.
Disclaimer: This SHIB price prediction is for educational purposes only and should not be considered financial advice. Cryptocurrency investments carry significant risks, and past performance does not guarantee future results. Always conduct your own research and consider your risk tolerance before making investment decisions.
Image source: Shutterstock- shib price analysis
- shib price prediction