Gold Price Prediction: 50-Year Pattern Points to $12,000 After a ~46% Correction
Gold has had quite a ride lately. After climbing from below $1,200 back in 2018 all the way to all-time highs above $5,600 in early 2026, the precious metal has hit the brakes pretty hard, pulling back more than 15% from its peak.
For investors watching this correction play out, the big question on everyone’s mind is whether the bull market is over or whether this is just a pit stop before the next leg higher.
Crypto Patel has a pretty strong take on this, and it’s not bearish. His analysis of a 50-year pattern on the gold chart indicates that what we’re seeing right now isn’t a trend reversal at all. In his view, it’s simply a healthy correction within a much larger, longer cycle that’s still very much intact.
The 50-Year Pattern That Keeps Repeating
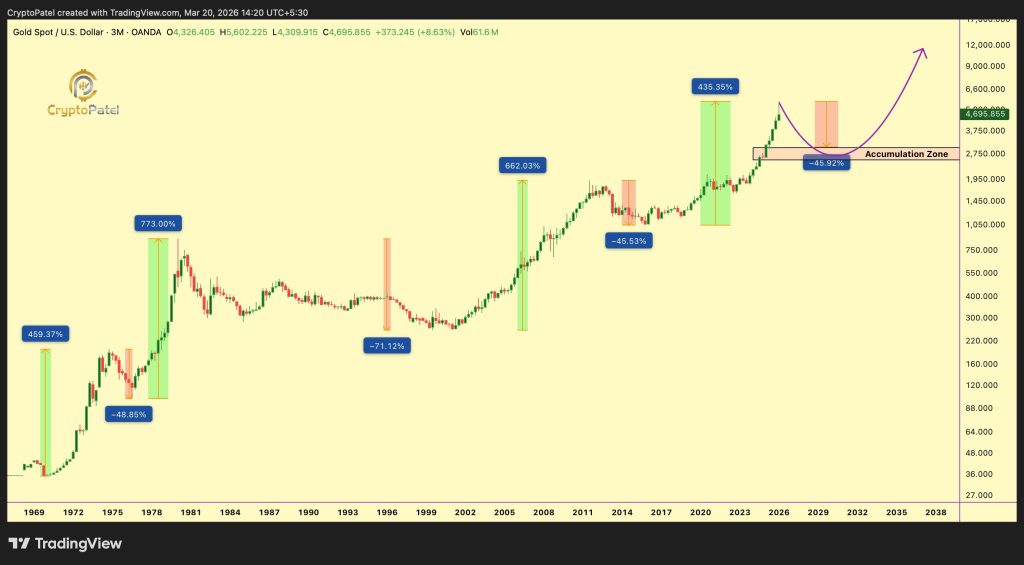
When you look at the 3-month chart Patel shared, the pattern is pretty hard to argue with. The chart goes all the way back to 1969 and tells a very consistent story: massive rallies, followed by deep corrections, followed by long periods of accumulation, and then explosive moves to new all-time highs.
The first major leg is almost hard to believe. Gold went from $35 all the way to $850, a gain of over 2,300%, before pulling back roughly 45%. Then the next cycle saw it run from $255 to $1,920, a gain of more than 650%, before once again correcting around 45%. Same playbook, different era.
 Source: X/@CryptoPatel
The most recent cycle saw the gold price climb from $1,050 to over $5,600, a gain of 435%, and that cycle is now in its correction phase.
Each time, the pattern repeats. A massive rally, a deep correction that shakes out weak hands, an accumulation zone where patient buyers step in, and then the next leg higher. The chart shows this rhythm playing out over five decades.
Where the Gold Price Is in the Current Cycle
The current cycle saw the gold price complete a 435 percent rally from the 2015 lows near $1,050 to the 2026 highs above $5,600. That move followed the same pattern as previous cycles. Now, the gold price is in the correction phase.
Crypto Patel expects a correction of roughly 46% from the highs, which would put the gold price in the $3,000 to $2,700 range. This zone is marked on the chart as the accumulation area where buyers would likely step in. The current gold price near $4,695 remains above this zone, suggesting more downside may be ahead before the accumulation phase begins.
The 46% figure is not arbitrary. It aligns with the corrections seen in previous cycles. After the 1980 peak, gold corrected roughly 45%. After the 2011 peak, gold corrected roughly 45%. History suggests a similar drawdown is likely this time.
The Next Target: $12,000
If the pattern holds, the next leg higher after this correction would be massive. Crypto Patel’s chart shows the next target at $12,000, representing more than 150% upside from the current gold price and more than 300% from the projected accumulation zone.
This target is not pulled from thin air. It represents the measured move from the pattern that has played out repeatedly over 50 years. Each rally leg has been larger than the last, and the chart suggests the next leg could be the biggest yet.
The accumulation zone between $3,000 and $2,700 would represent a 46% to 50% correction from the highs. That is a deep drawdown, the kind that shakes out the weak hands and creates the conditions for the next leg higher. For investors with a long-term view, that zone could represent the opportunity of a cycle.
Read Also: Retail Investors Are Piling Into Gold and Silver While Institutions Quietly Exit – Here’s the Data
What Comes Next for the Gold Price
The gold price now sits at a critical juncture. The short-term trend shows a market in correction, but the long-term pattern indicates this is exactly where the opportunity lies. Crypto Patel’s analysis provides a clear roadmap.
The gold price must find support in the $3,000 to $2,700 zone to validate the pattern. If that accumulation zone holds, the next leg higher could target $12,000 over the coming years. A break below $2,700 would put the pattern at risk and suggest that this cycle is different.
For now, the 50-year pattern remains intact. The question is not whether the gold price will recover, but whether investors have the patience to wait out the correction and position for the next leg higher. History says the reward for that patience could be significant.
Subscribe to our YouTube channel for daily crypto updates, market insights, and expert analysis.
The post Gold Price Prediction: 50-Year Pattern Points to $12,000 After a ~46% Correction appeared first on CaptainAltcoin.


You May Also Like
Crypto Fear & Greed Index Holds Steady at 52: Market Sentiment Remains Neutral
Major Token Unlocks This Week: $68M in AVAX, APT, CONX, STRK, and ARB Set to Hit the Market