Dogecoin (DOGE) Price Poised for 350% Breakout, Technical Patterns Suggest
Key Takeaways
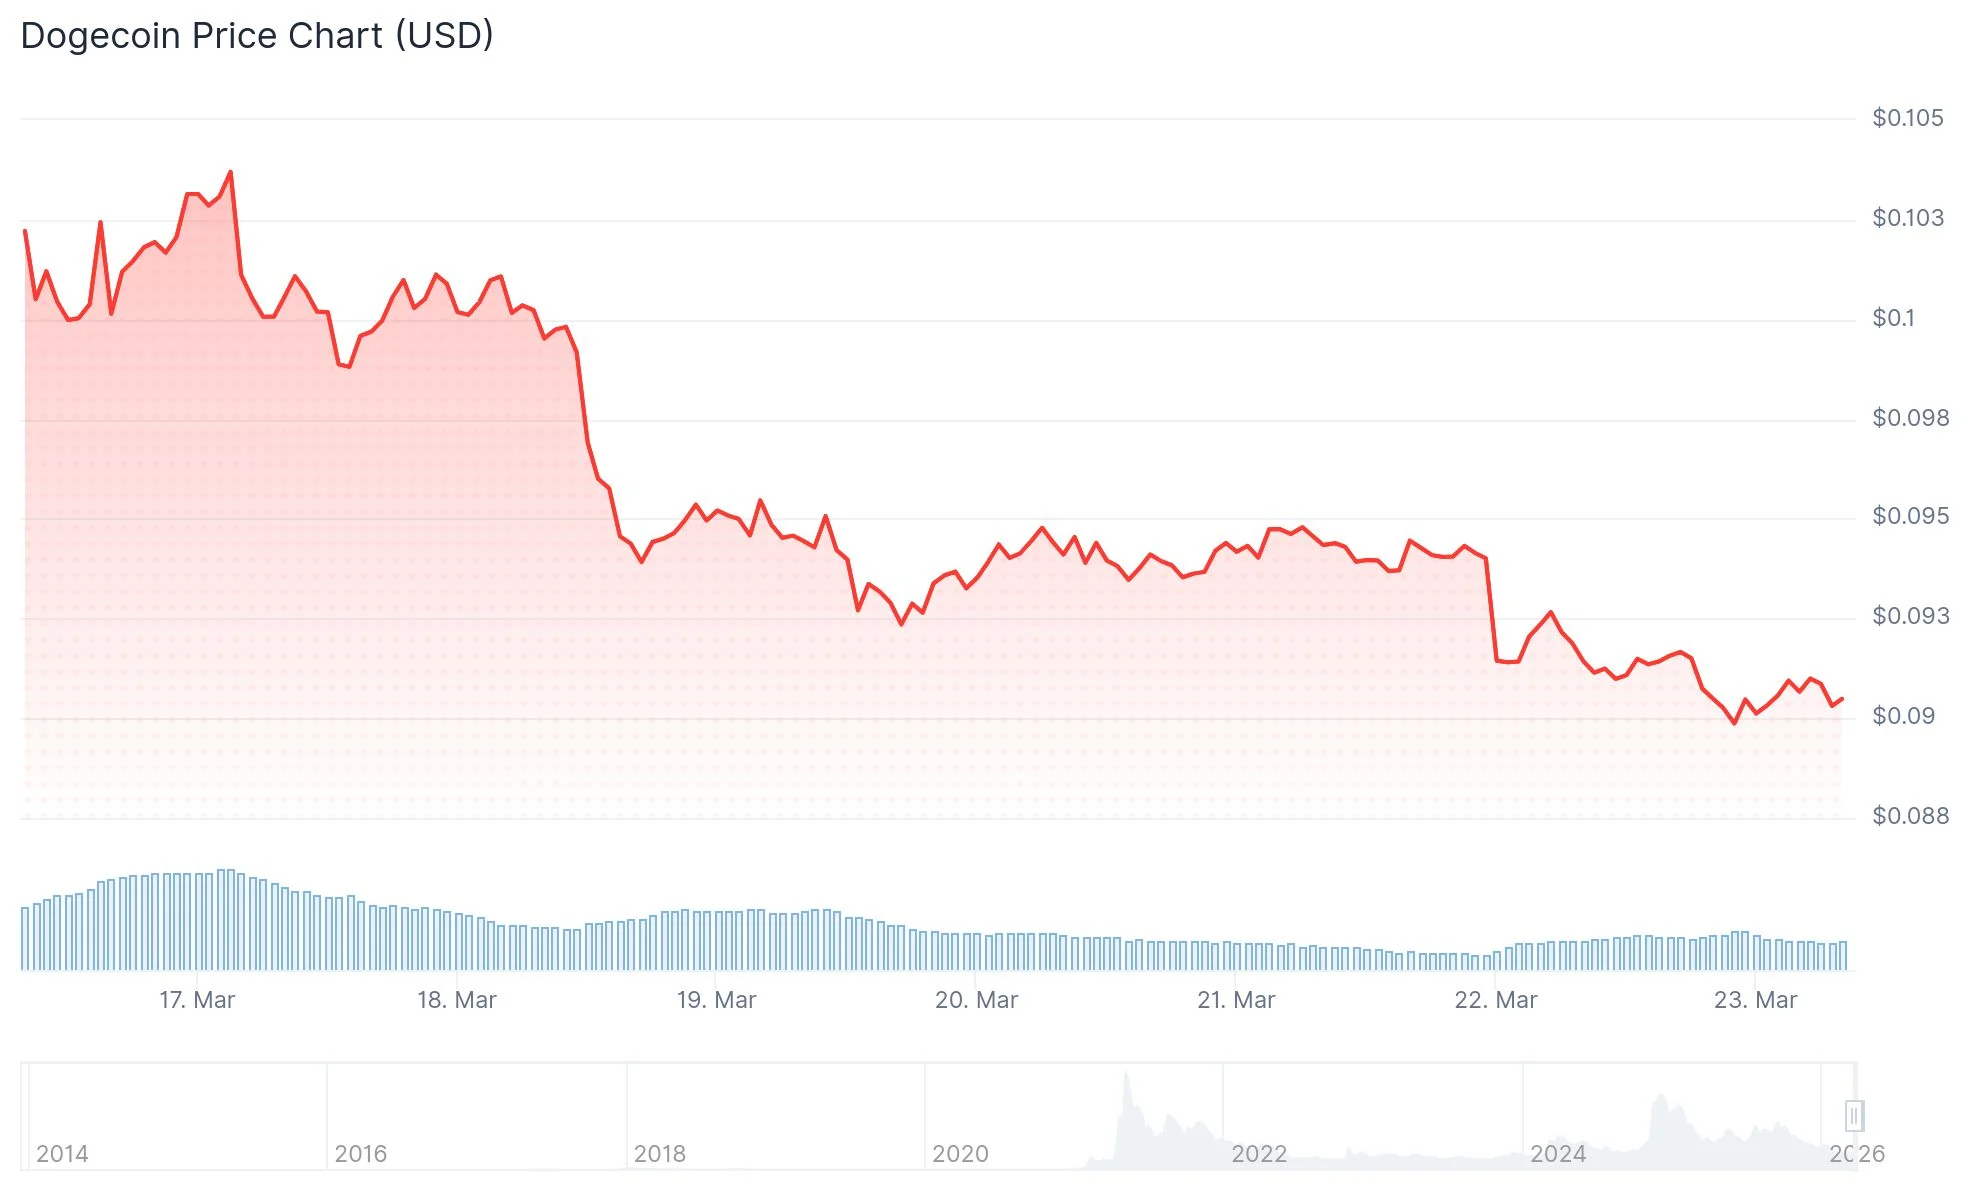
- DOGE consolidates around $0.094 within a descending triangle pattern established since the 2021 all-time high
- Critical resistance level at $0.10 could unlock price objectives between $0.20 and $0.30
- Elliott Wave framework indicates DOGE may be finishing its final corrective phase around $0.093–$0.094
- Technical analyst Javon Marks spots hidden bullish divergence with potential upside to $0.44
- Blockchain metrics reveal 60,000–110,000 daily active addresses, indicating consistent network engagement
Dogecoin (DOGE) currently hovers around $0.094 as of March 21–22, 2026, confined within a prolonged technical consolidation structure that market participants are monitoring with keen interest.
 Dogecoin (DOGE) Price
Following its peak at $0.73 in May 2021, DOGE has experienced approximately 73% depreciation and transitioned into a lengthy consolidation period. The weekly timeframe reveals a formation of descending peaks creating a triangle configuration, with price support maintained within the $0.055 to $0.08 corridor.
Chart analyst CryptoPatel drew attention to this formation, observing that DOGE is positioned close to the upper limit of this extended compression area. This pattern indicates diminishing volatility as downward momentum weakens.
Analyst Crypto Lens identifies a 5-year demand region surrounding $0.07867. Historical breakouts from comparable formations delivered returns of +173%, +180%, and +421%, although historical performance doesn’t ensure future replication.
Elliott Wave Analysis and Momentum Divergence
Certain market observers interpret the current structure using Elliott Wave methodology. According to this framework, DOGE appears to be finalizing the fifth and concluding segment of a corrective downtrend, with Fibonacci projections clustering between $0.093 and $0.094.
Should this wave sequence conclude near present price levels, buying interest may emerge to challenge resistance around $0.098–$0.10.
Independently, analyst Javon Marks has detected a hidden bullish divergence developing within the $0.093–$0.095 territory. While price establishes higher lows above $0.09, momentum indicators are recording lower lows — a technical condition frequently linked to diminishing bearish momentum.
Marks proposes that if this divergence materializes as expected, DOGE might surge beyond 350%, reaching price levels exceeding $0.44 from approximately $0.093.
Critical Price Zones Under Observation
TradingView technical summaries continue displaying a “Sell” orientation across moving average metrics. Momentum oscillators such as RSI and Stochastic maintain predominantly neutral readings.
Market participants are focusing on these crucial levels:
- Resistance zones: $0.095 and $0.098
- Major psychological barrier: $0.10
- Support foundations: $0.092 and $0.088–$0.090
A weekly candle closing beyond the descending trendline, accompanied by volume surge, would constitute the most definitive bullish confirmation. Chart-based projection techniques indicate a breakthrough above $0.10 might establish objectives within the $0.20–$0.30 spectrum.
Blockchain analytics from Glassnode and IntoTheBlock document daily active addresses fluctuating between 60,000 and 110,000, with daily transaction counts spanning 80,000 to 200,000.
As of March 22, 2026, DOGE registered at $0.09191, reflecting a 2.81% decline across the preceding 24-hour period. The $0.09 support threshold remains the critical structural foundation under trader observation.
The post Dogecoin (DOGE) Price Poised for 350% Breakout, Technical Patterns Suggest appeared first on Blockonomi.


You May Also Like

Trump's allies set a trap — don't fall for it

Luxor Ships Commander Software to Optimize Bitcoin Mining Fleet Profitability – News Bytes Bitcoin News