TTF Gas Crisis: LNG Shock Abruptly Ends Europe’s Surplus Era – Rabobank Analysis
BitcoinWorld
TTF Gas Crisis: LNG Shock Abruptly Ends Europe’s Surplus Era – Rabobank Analysis
The European natural gas market faces a dramatic structural shift as liquefied natural gas supply disruptions abruptly terminate years of comfortable surplus conditions, according to Rabobank’s latest energy analysis. This TTF gas market transformation carries significant implications for energy security, pricing mechanisms, and industrial competitiveness across the continent.
TTF Gas Market Enters New Deficit Phase
Rabobank’s comprehensive market assessment reveals that Europe’s Title Transfer Facility benchmark has entered a fundamentally different pricing environment. The Dutch TTF gas hub, which serves as Europe’s primary pricing reference, now reflects persistent structural tightness rather than the oversupply that characterized previous years. Market analysts observe that several converging factors created this new reality.
Firstly, global LNG demand growth continues to outpace supply expansion. Asian markets, particularly China and Japan, maintain strong import requirements that compete directly with European buyers. Secondly, production constraints in key exporting nations like Qatar, Australia, and the United States limit available spot volumes. Thirdly, Europe’s own production continues its long-term decline, increasing import dependency.
The transition manifests in several measurable indicators:
- Storage trajectory divergence: Inventory builds lag historical averages despite adequate injection periods
- Forward curve structure: Winter-summer spreads widen significantly, indicating supply concerns
- Price volatility: Daily TTF fluctuations exceed 5% more frequently than in previous years
- Regional basis differentials: Southern European hubs trade at increasing premiums to TTF
LNG Supply Shock Mechanics and Timeline
The liquefied natural gas market experienced multiple simultaneous disruptions that created the current supply shock. A chronological examination reveals how these events unfolded and compounded each other’s effects. The timeline begins in early 2024 and extends through the present analysis period.
In February 2024, unplanned maintenance at several US liquefaction facilities removed approximately 5% of global capacity for six weeks. During March, political tensions in key transit regions affected shipping routes and insurance costs. By April, Asian buyers began securing longer-term contracts, reducing spot market availability. The summer months saw weather-related disruptions at Australian facilities, while European storage refill requirements intensified competition.
| Timeline | Event | Impact (Million Tons) |
|---|---|---|
| Q1 2024 | US facility maintenance | -8 MT annualized |
| Q2 2024 | Asian contract renewals | -12 MT spot reduction |
| Q3 2024 | Australian weather issues | -6 MT quarterly |
| Q4 2024 | European storage competition | +15 MT demand surge |
| Q1 2025 | Global demand acceleration | +8 MT year-over-year |
These sequential events created cumulative pressure that the market could not absorb through existing flexibility mechanisms. Consequently, the traditional surplus buffer evaporated faster than most analysts anticipated. Market participants now operate in an environment where supply security concerns dominate trading decisions.
Rabobank’s Analytical Framework
Rabobank’s energy team employs a multi-factor model to assess market transitions. Their methodology combines quantitative data analysis with qualitative assessment of geopolitical and regulatory developments. The bank’s researchers examine storage levels, pipeline flows, LNG deliveries, weather patterns, and industrial demand simultaneously.
Furthermore, they incorporate forward-looking indicators like contracting activity, infrastructure development timelines, and policy announcements. This comprehensive approach allows Rabobank to identify structural shifts before they fully manifest in price data. Their current assessment suggests the surplus era ended approximately six months earlier than mainstream forecasts predicted.
European Energy Security Implications
The transition from surplus to deficit conditions fundamentally alters Europe’s energy security calculus. Policymakers and market operators must now prioritize supply assurance over price optimization. This shift requires adjustments across multiple dimensions of energy strategy and infrastructure planning.
Storage management becomes more conservative, with higher minimum inventory targets throughout the year. Contracting strategies emphasize duration and volume certainty over spot market exposure. Infrastructure development accelerates for both LNG import capacity and pipeline interconnections. Additionally, demand-side measures gain renewed importance for balancing the system during tight periods.
Several specific impacts merit particular attention:
- Industrial competitiveness: Energy-intensive industries face higher and more volatile input costs
- Power generation mix: Gas-fired plants encounter fuel availability constraints during peak demand
- Price formation: Marginal pricing increasingly reflects LNG cargo costs rather than pipeline economics
- Regional integration: Market coupling mechanisms face stress tests during supply shortages
Market Structure Evolution and Future Projections
The TTF gas market’s structure continues evolving in response to these fundamental changes. Trading patterns, contract specifications, and risk management practices all undergo adaptation. Market participants develop new tools and strategies to navigate the more challenging environment.
Forward curve dynamics show increased backwardation during injection seasons, reflecting storage value appreciation. Options markets exhibit higher implied volatility across all tenors. Physical trading incorporates more sophisticated logistics optimization to manage scarce transportation capacity. Financial products evolve to provide better hedging for the new risk profile.
Rabobank projects several developments through 2026:
- Increased vertical integration between buyers and suppliers
- More destination-flexible LNG contracts with European options
- Greater regulatory focus on market transparency and manipulation prevention
- Enhanced coordination between gas and electricity market operations
- Development of new price benchmarks for specific regional markets
Comparative Analysis with Previous Transitions
Historical examination reveals that similar market transitions occurred in 2005-2008 and 2012-2014. However, the current shift differs in both magnitude and driving factors. Previous transitions primarily resulted from demand growth outpacing supply investment. The current situation involves simultaneous supply disruptions and accelerated demand recovery.
Additionally, the market now operates with different regulatory frameworks and infrastructure configurations. The European Union’s market integration initiatives created more interconnected but also more complex systems. Climate policies introduce additional dimensions to energy procurement decisions. These factors combine to make the current transition uniquely challenging for market participants.
Conclusion
Rabobank’s analysis confirms that Europe’s TTF gas market has conclusively exited its prolonged surplus era. LNG supply shocks combined with structural demand changes created a new deficit environment with significant implications. Market participants must adapt their strategies to prioritize security and flexibility over cost minimization. The transition presents challenges but also opportunities for innovation in trading, contracting, and risk management. As the market adjusts to its new reality, continued monitoring of both fundamental indicators and structural developments remains essential for informed decision-making.
FAQs
Q1: What exactly is the TTF gas benchmark?
The Title Transfer Facility (TTF) is Europe’s leading natural gas trading hub based in the Netherlands. It serves as the primary price reference for wholesale gas contracts across Northwestern Europe, similar to how Brent crude functions for oil markets.
Q2: How long did Europe’s gas surplus era last?
The surplus period persisted for approximately eight years from 2016 through 2024, driven by abundant LNG supplies, mild weather patterns, and subdued industrial demand during economic transitions.
Q3: What are the main causes of the current LNG supply shock?
Multiple factors converged including unplanned maintenance at export facilities, increased Asian contract commitments, weather-related production disruptions, and accelerated European storage refill requirements during 2024.
Q4: How does this affect European household energy bills?
Wholesale price increases typically translate to higher retail costs over time, though regulatory mechanisms, hedging strategies, and government interventions can moderate and delay the impact on consumers.
Q5: What strategies can industries use to manage higher gas costs?
Options include forward contracting for price certainty, efficiency improvements to reduce consumption, fuel switching where feasible, operational flexibility to reduce peak demand, and participation in demand response programs.
This post TTF Gas Crisis: LNG Shock Abruptly Ends Europe’s Surplus Era – Rabobank Analysis first appeared on BitcoinWorld.


You May Also Like
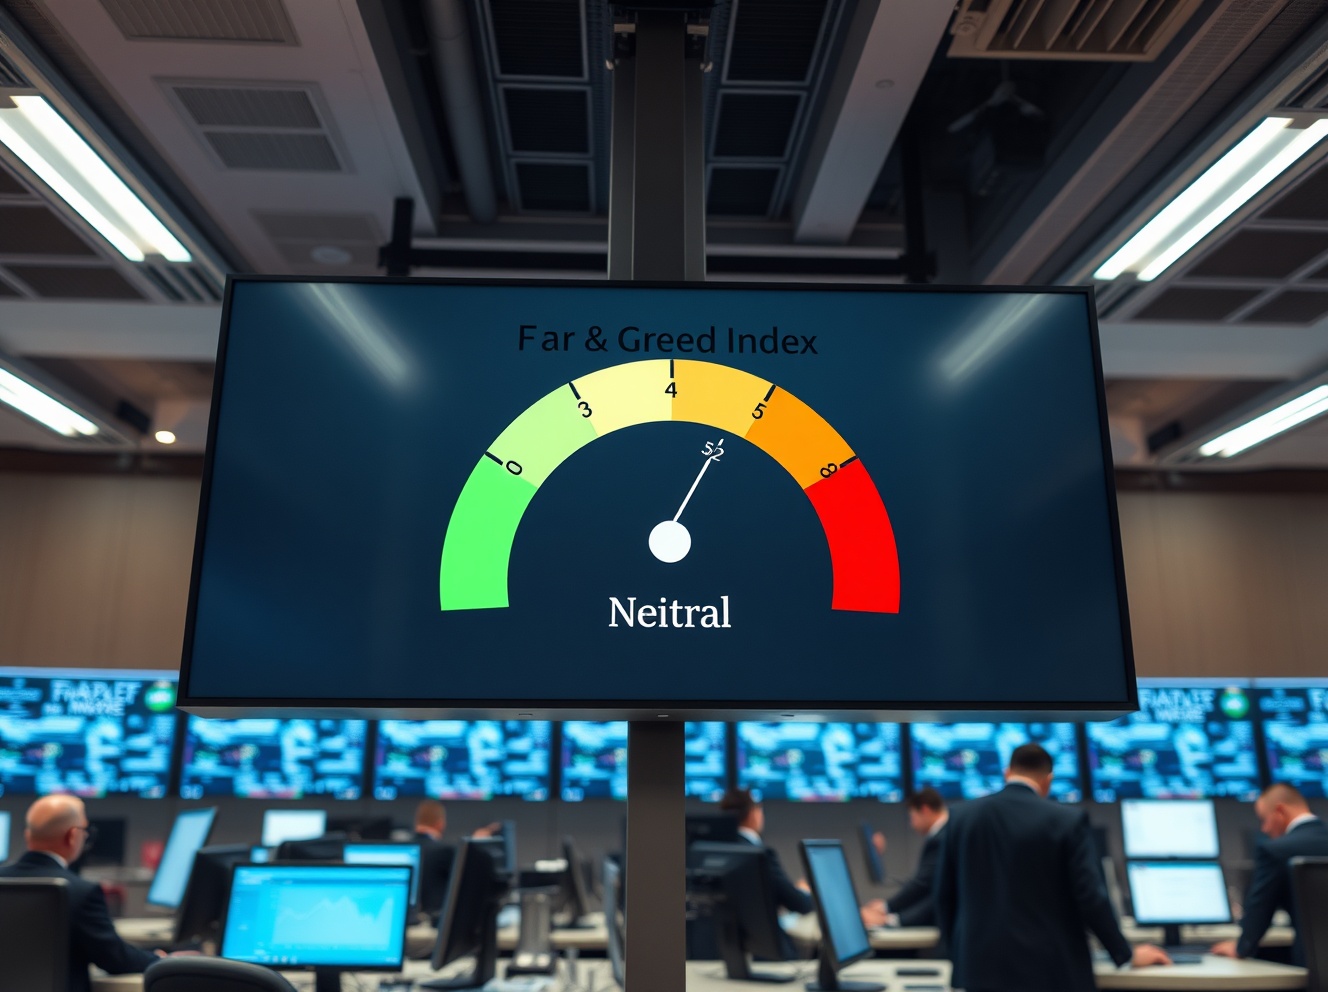
Crypto Fear & Greed Index Holds Steady at 52: Market Sentiment Remains Neutral

Major Token Unlocks This Week: $68M in AVAX, APT, CONX, STRK, and ARB Set to Hit the Market