

Shiba Inu’s Bullish Divergence Sparks Hopes of SHIB Price Rally
Shiba Inu is showing signs of a possible upward move after the formation of a bullish divergence on the daily chart. This technical development suggests that despite recent price declines, underlying momentum may be strengthening, creating conditions for a potential price recovery in the near term.
Recent price action shows SHIB recording consecutive daily gains, marking a short-term recovery from its recent lows. Over the past few sessions, the token has risen by approximately 9%, a sign of renewed buying interest. This movement coincides with a broader technical setup that traders usually associate with a shift in market direction.
Bullish Divergence Suggests Strength in Weakness
An analysis of SHIB’s daily chart shows a divergence between price movement and the RSI indicator. While the asset has recorded lower price points, the RSI has gradually increased from oversold levels. This pattern typically reflects weakening selling pressure and the possibility of an upcoming upward correction.
This is not the first time such a pattern has appeared in recent months. Toward the end of December, a similar pattern developed as the RSI rose from 29 to 34, even as the price declined from $0.00000753 to $0.00000682. That setup was followed by a strong rally of more than 20%, with SHIB reaching approximately $0.00001009 in early January.
A comparable scenario occurred between early February and early March. During that period, the RSI improved from 23.7 to 33.7, despite the price falling from $0.00000663 to $0.00000523. The repetition of this pattern reinforces the possibility that current market conditions could lead to another upward move.
Support Levels
Price stability around key support levels further supports the bullish case. SHIB has consistently found buying interest near the $0.00000504 range. Attempts to push the price lower have been met with rebounds, showing that this zone is being defended by buyers.
If upward momentum continues, the first significant resistance level lies at $0.00000725, which represents the most recent lower high. A successful move to this level would imply a moderate gain from current prices. Beyond that, attention shifts to the 200-day simple moving average at approximately $0.00000864. Reaching this level would indicate a more substantial recovery.
Moving Average Break Strengthens Outlook
Another important development is SHIB’s recent movement above its 50-day exponential moving average. This indicator is widely used to assess trend direction, and a sustained position above it is often interpreted as a sign of improving market structure.
Currently, the 50-day EMA sits slightly below the current price, suggesting that the token has transitioned into a more favorable technical position. Maintaining this level of support will be critical for sustaining upward momentum.
Additionally, SHIB is trading above other short-term moving averages, including the 23-day and 50-day simple moving averages. These indicators now act as dynamic support levels, reinforcing the potential for continued price appreciation.
The combination of bullish divergence, strong support zones, and improving positioning relative to key moving averages indicates that SHIB may be entering a recovery phase. If the asset holds above current support levels, it will guarantee continued strength.
Disclaimer: This content is meant to inform and should not be considered financial advice. The views expressed in this article may include the author’s personal opinions and do not represent Times Tabloid’s opinion. Readers are urged to do in-depth research before making any investment decisions. Any action taken by the reader is strictly at their own risk. Times Tabloid is not responsible for any financial losses.
Follow us on Twitter, Facebook, Telegram, and Google News
The post Shiba Inu’s Bullish Divergence Sparks Hopes of SHIB Price Rally appeared first on Times Tabloid.


You May Also Like

Sky Dropped -2.59% in Last Month and is Predicted to Drop to $ 0.055716 By May 19, 2026
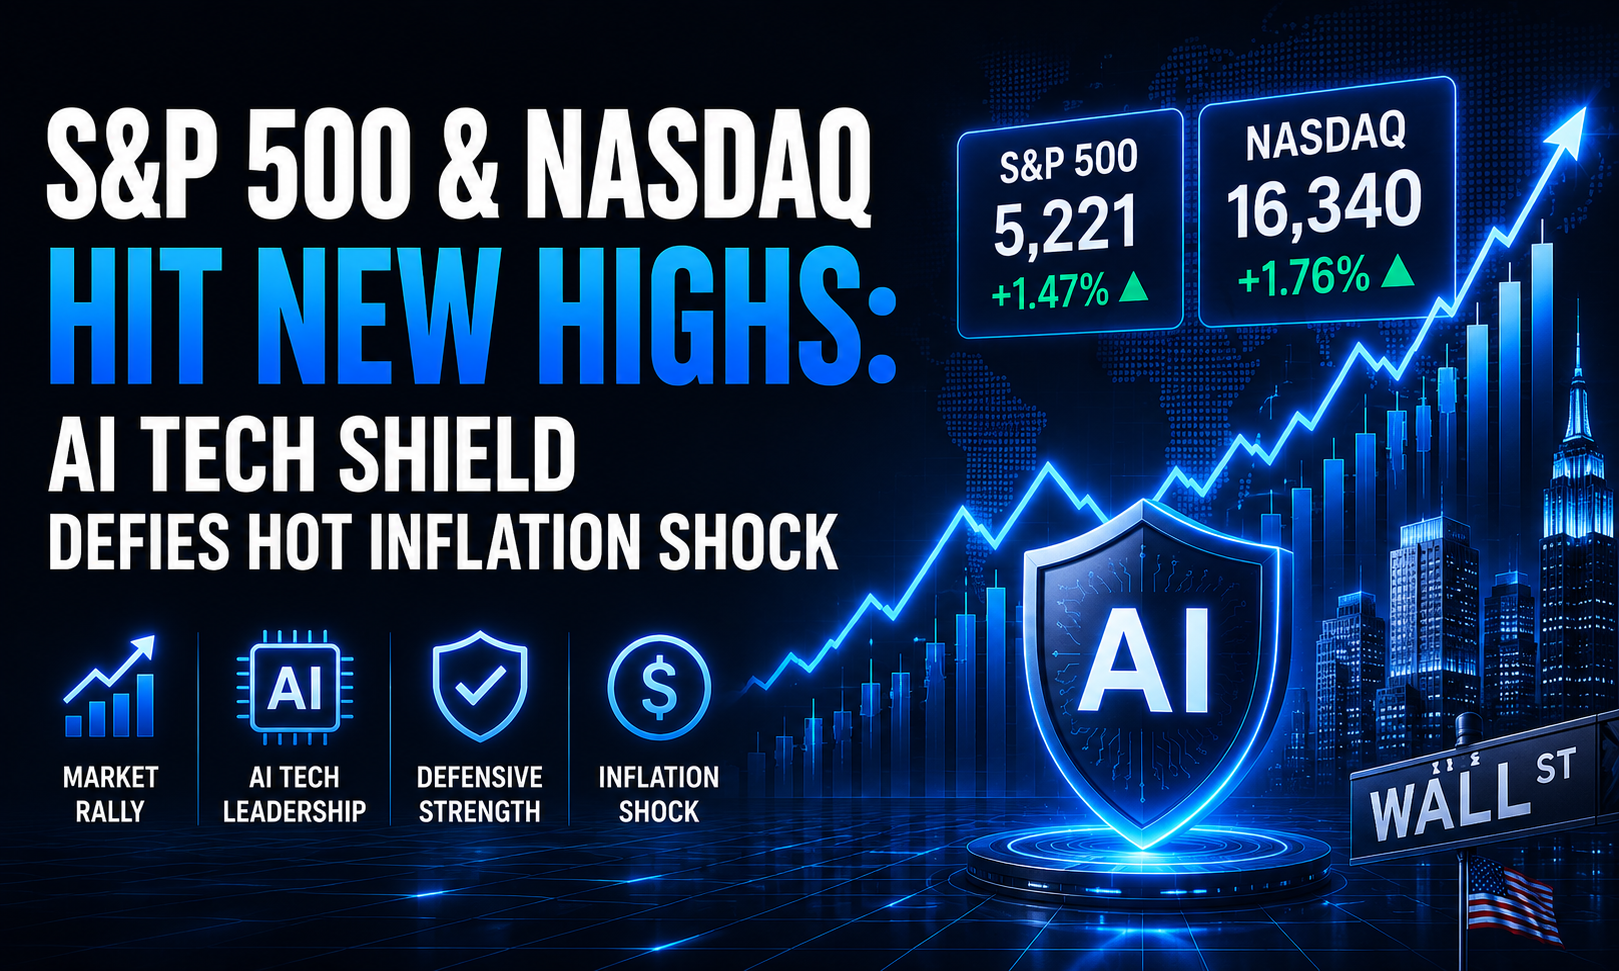
S&P 500 & Nasdaq Hit New Highs: AI Tech Shield Defies Hot Inflation Shock


