Netflix Stock Holds Neutral Bias as NFLX Trades Near Short-Term Support After Pullback

 NFLX — daily chart with candlesticks, EMA20/EMA50 and volume.
Netflix Stock (NFLX) Holds Neutral Bias Near Short-Term Support
Netflix stock (NFLX) is stabilizing after a recent pullback, with the daily chart signaling a neutral-to-constructive bias as price hovers just above short-term support.
Daily Chart: Netflix Stock in Mid-Range Consolidation
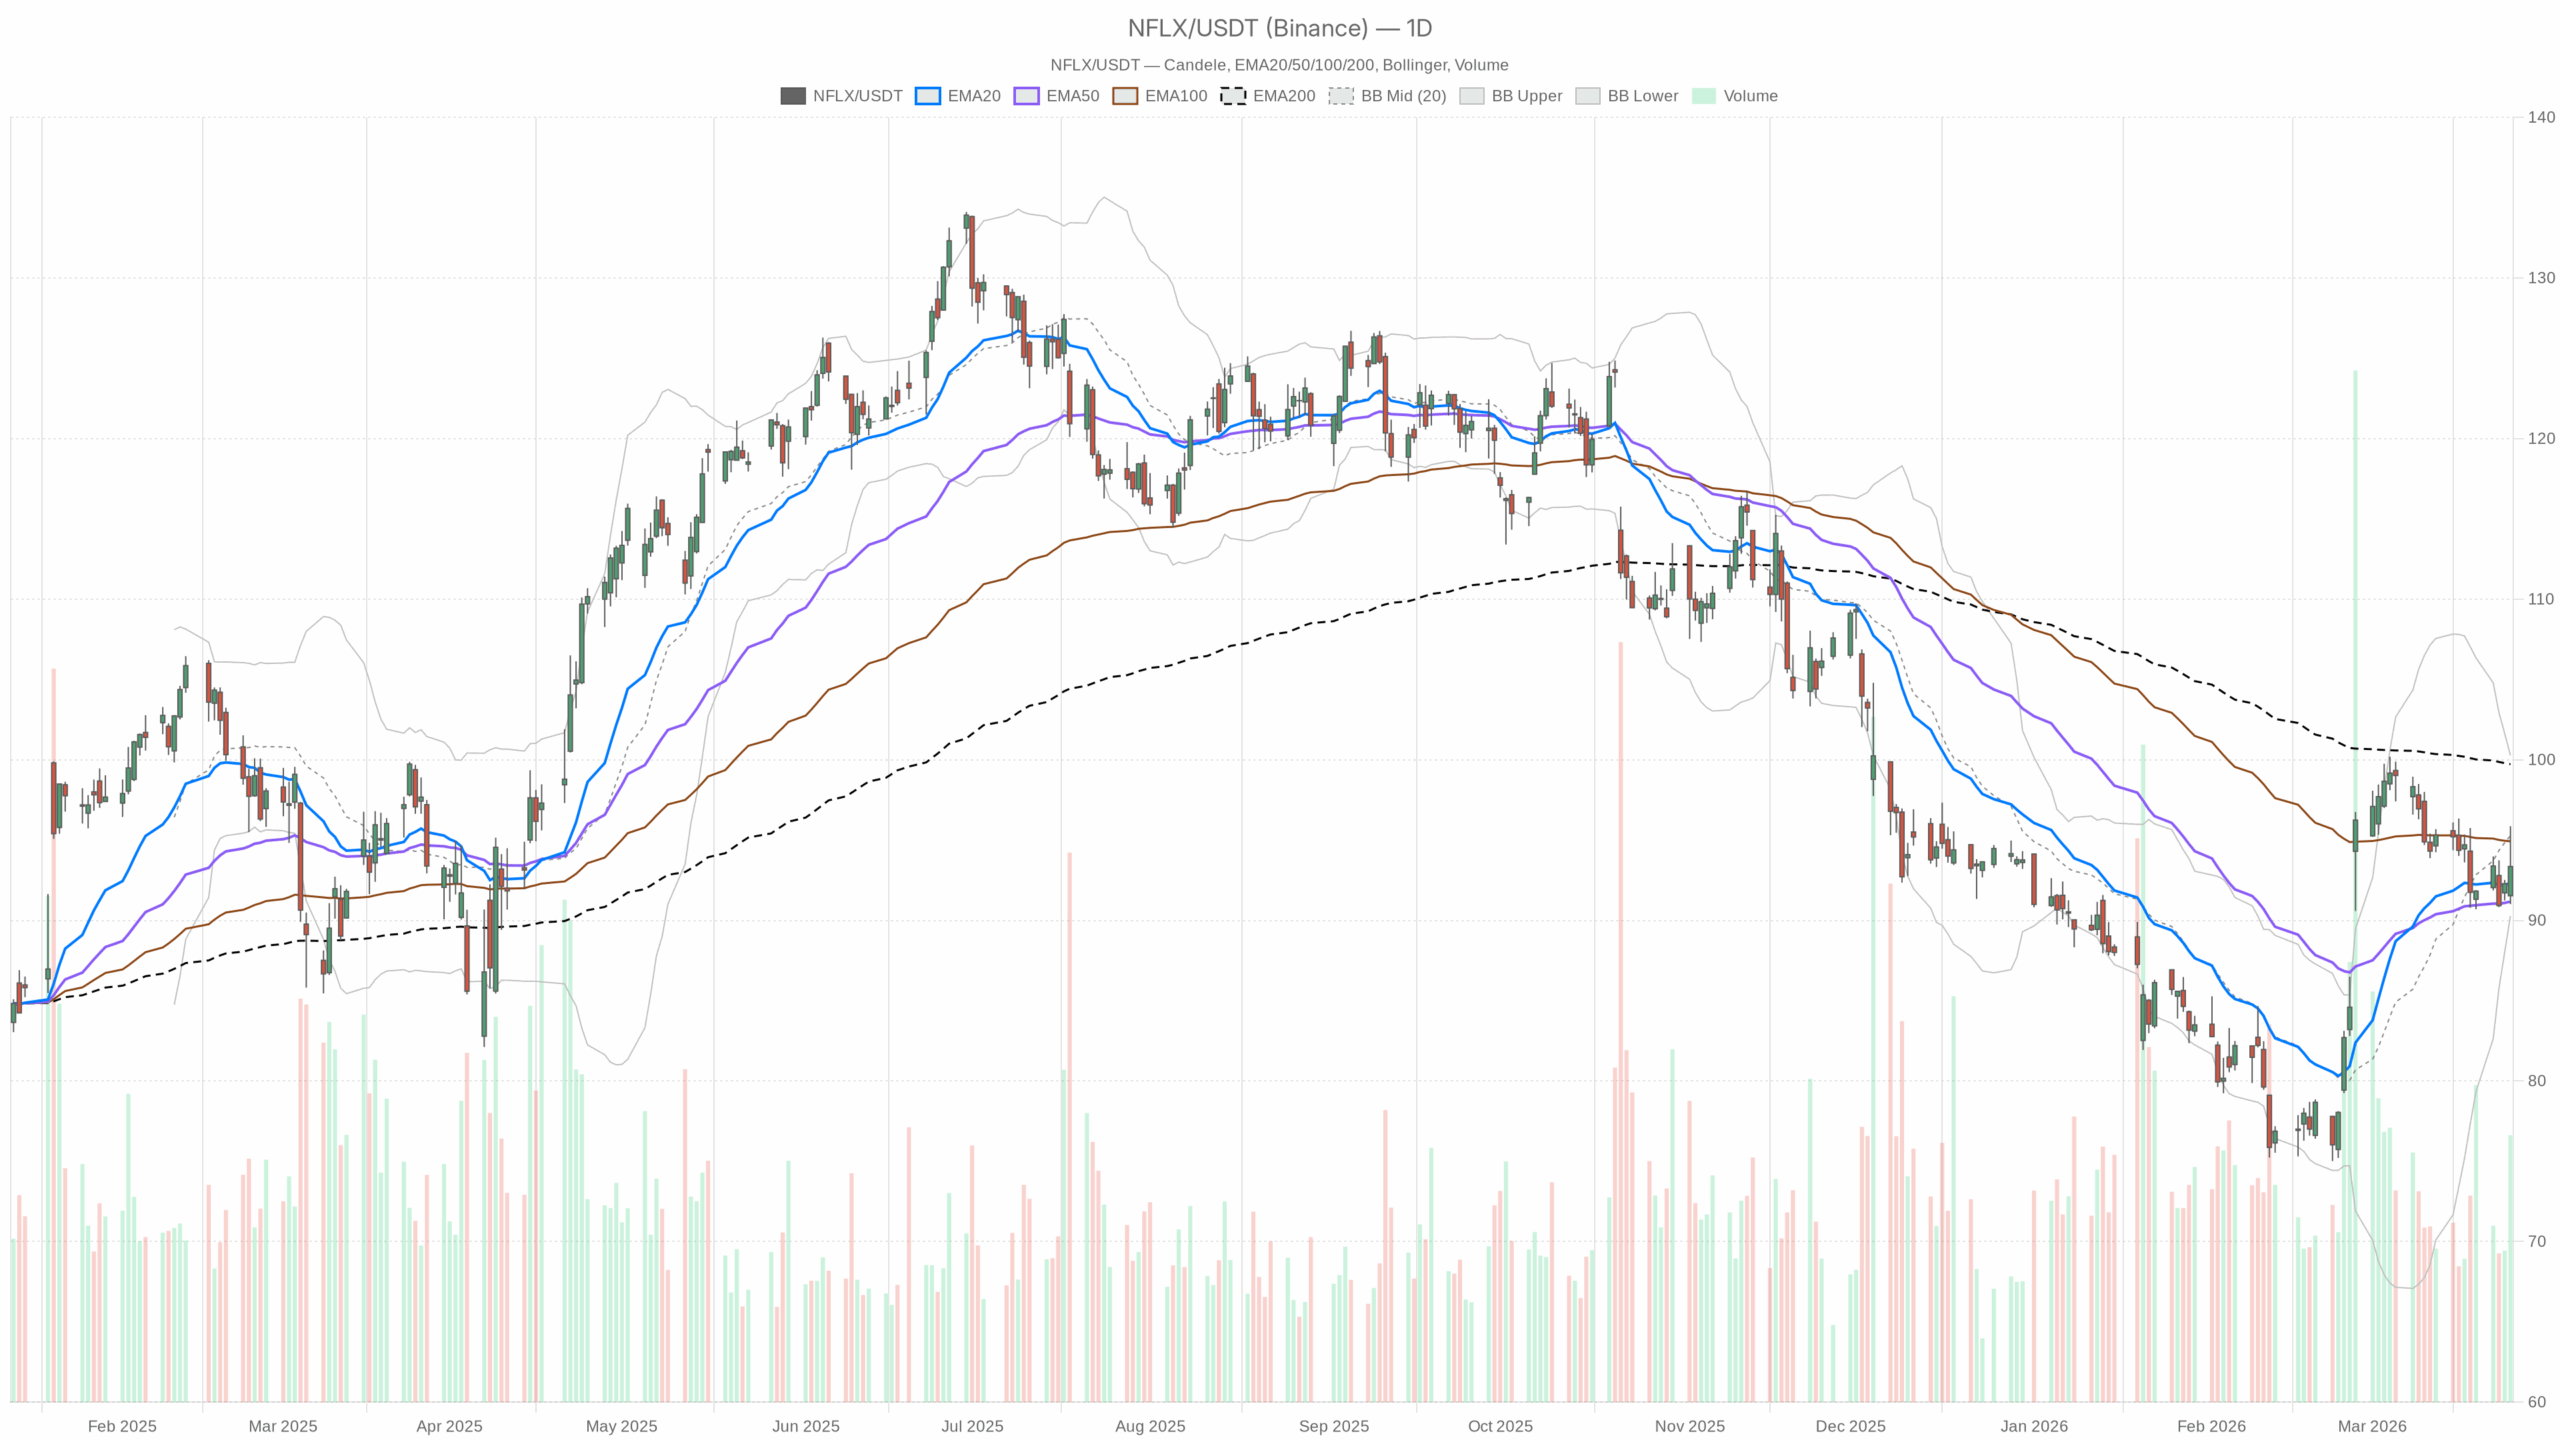
On the daily timeframe, NFLX closed at $93.35, up from an intraday low of $91.01 but below the session high of $95.86. That intraday reversal shows dip-buying interest emerging closer to $91–92. However, the failure to hold near the highs underlines a market still unwilling to chase. Overall, the stock is trading in the middle of a broader consolidation band rather than in a strong trend.
Daily EMAs: Short-Term Support, Long-Term Ceiling
Technically, the daily structure leans neutral with a slight bullish tilt. Price sits just above the 20-day EMA at $92.32 and the 50-day EMA at $91.17, while it remains below the 200-day EMA at $99.72. Trading above the 20- and 50-day EMAs shows the short-term trend has turned mildly upward after the recent pullback. However, the 200-day EMA overhead highlights that the longer-term trend is still under pressure and that rallies toward $100 are likely to face supply.
Daily Momentum: RSI Mildly Positive, MACD Fading
The daily RSI at 54.71 is slightly above the midline. This positioning reflects modest bullish momentum but not a strong impulse; the move is neither overbought nor oversold, consistent with a grinding consolidation rather than a breakout or breakdown. It tells us buyers have a slight edge, but conviction remains contained.
However, the daily MACD is mixed. The MACD line stands at 1.35 versus a signal line at 2.02, leaving the histogram negative at -0.66. The negative histogram signals that the recent upside push is losing speed, even though price holds above short-term averages. That divergence between stable price and softening momentum argues against an aggressive bullish stance and supports the “neutral with a soft bullish bias” view for Netflix stock.
Bollinger Bands and ATR: Controlled Volatility for NFLX
Bollinger Bands on the daily chart show the mid-band at $95.27 with upper and lower bands at $100.26 and $90.28, respectively. With price at $93.35, NFLX trades closer to the lower half of the band but well off the bottom. This placement indicates volatility remains moderate and price is oscillating within a defined range rather than trending strongly in one direction.
Daily ATR stands at 2.46. That implies typical daily swings of roughly 2.5%–3% around the current quote, which is neither distressed nor unusually quiet for a high-profile tech and media name. It gives traders room on both sides but does not point to a volatility shock.
Daily Pivots: Immediate Balance Near Current Price
From a tactical level standpoint, the daily pivot sits at $93.41, with first resistance (R1) at $95.80 and first support (S1) at $90.95. Price closed essentially on the pivot, reflecting an intraday balance of power between buyers and sellers. R1 around $95.80 lines up with today’s high region, making it a near-term upside line in the sand. Meanwhile, S1 near $91 aligns with the intraday low and marks the first meaningful support before the lower Bollinger band near $90.
Fundamental Backdrop: Price Hikes, Upgrade, and Strategic Questions
Overlaying the technical picture, recent news flow is mixed but leans fundamentally constructive for Netflix stock. Netflix has announced subscription price increases across all tiers. Higher pricing can support revenue and margin growth, especially against the backdrop of strong revenue trends highlighted by recent analyst commentary. At the same time, it raises questions about customer sensitivity in a crowded streaming market, which may cap how aggressively investors re-rate the stock in the short term.
Additionally, Erste Group has upgraded its rating on Netflix, citing strong revenue growth. Fresh upgrades tend to provide a psychological backstop on pullbacks, as they validate the fundamental story for medium-term holders. That said, recent articles surrounding Netflix’s decision to walk away from a potential Warner Bros. deal highlight strategic uncertainty about content scale and partnerships. Investors must now judge whether Netflix can sustain its next phase of growth organically, without a large external library infusion, which keeps a ceiling on near-term enthusiasm.
Hourly Chart: NFLX in Modest Short-Term Uptrend
On the hourly chart, the picture broadly supports the daily neutral-to-slightly-bullish stance, though not emphatically. NFLX’s last 1-hour candle shows a close at $93.35, flat on the hour and near the session pivot at $93.49. Price is sitting above the 20-hour EMA at $92.75 and essentially in line with the 50-hour EMA at $92.96, while the 200-hour EMA trails lower at $91.13. This configuration shows a modest, established intraday uptrend off recent lows. Yet the flattening alignment of the 20- and 50-hour EMAs suggests momentum is easing as price consolidates.
Hourly Momentum and Volatility: Gentle Upside Bias
The hourly RSI at 55.89 is modestly bullish. It confirms a slight advantage for buyers but, again, with no sign of exhaustion. Meanwhile, the hourly MACD line is at 0.21 versus a 0.01 signal, with a positive histogram of 0.20. The positive cross and small histogram reflect a gentle upward push after the latest intraday dip, consistent with buyers defending the low-$93s rather than launching a strong rally.
Hourly Bollinger Bands show the mid-line at $92.41, with the upper band at $93.88 and the lower at $90.94. Price hugging the upper half but not breaking through the upper band points to steady but controlled buying pressure in Netflix stock. Hourly ATR of 1.09 confirms that intraday swings are active but not disorderly, which is typical into and after news-rich days.
Hourly Pivots: Micro Range Around $93
The hourly pivot at $93.49, with R1 at $93.73 and S1 at $93.11, frames the short-term battlefield. With price pinned just under the pivot, the market is pausing to reassess after the recent news and pullback. Sustained trading above $93.50 would open the door to a retest of $93.70–$94. On the other hand, repeated failures here raise the odds of a drift back toward $93.10 and, if that breaks, the $91–92 support zone seen on the daily chart.
15-Minute Chart: Intraday Consolidation Around $93.30–$93.50
On the 15-minute chart, the tape is quiet and mostly confirms consolidation around the $93.30–$93.50 area. The last 15-minute candle closed at $93.35, with a narrow range between $93.25 and $93.69. The 20-bar EMA stands at $93.28, the 50-bar EMA at $92.85, and the 200-bar EMA at $93.01. With price only a few cents above the short averages and those averages themselves tightly grouped, the very short-term flow is balanced. There is no clear intraday directional push at this moment.
15-Minute Momentum and Bands: Neutral Intraday Tone
The 15-minute RSI sits at 53.37. That confirms a slightly positive but largely flat intraday mood. The 15-minute MACD line at 0.32 versus a signal at 0.30 produces a very small positive histogram of 0.02. This points to a slight edge for buyers in the immediate term but with almost no momentum behind it.
Short-term Bollinger Bands on the 15-minute chart show a mid at $93.15 with upper and lower bands at $94.32 and $91.98. Price near the mid-band gives intraday traders room to lean in either direction, which typically precedes a small expansion in volatility. The 15-minute ATR of 0.78 indicates a typical quarter-to-half-dollar fluctuation over a short window, framing the near-term noise level in Netflix stock.
15-Minute Pivots: Execution Zone Around $93.40
The 15-minute pivot at $93.43, with R1 at $93.61 and S1 at $93.17, is tightly wrapped around current price. This creates a compact execution band for short-term participants: pushes above $93.60 would signal immediate buying pressure, while slips below $93.20 would indicate sellers gaining the upper hand in the very near term.
Cross-Timeframe View: Neutral Bias With Soft Bullish Skew
Putting the timeframes together, the primary bias for Netflix remains neutral with a subtle bullish skew. The daily chart shows short-term support holding above the 20- and 50-day EMAs and RSI in mildly positive territory. Meanwhile, the hourly and 15-minute charts show buyers defending the low-$93 area but lacking the momentum to break convincingly higher. The main tension comes from the daily MACD, which has rolled over, versus the still-positive hourly and 15-minute MACD readings. This conflict underscores that the recent bounce is more of a stabilization phase after a pullback than the start of a strong new uptrend.
Bullish Scenario for Netflix Stock: What Would Strengthen the Case?
From here, the bullish scenario centers on the market embracing the price hikes and analyst upgrades as validation of Netflix’s pricing power and revenue trajectory. For this scenario to gain traction, NFLX would need to hold above the daily support band around the 20- and 50-day EMAs ($91–$92) and convert the daily pivot at $93.41 into a reliable floor. A sustained push through the daily pivot and then above the R1 zone at $95.80 would be an important next step.
Daily MACD would need to flatten and turn higher, while RSI would need to move decisively into the 60s. Price would ideally challenge the Bollinger mid-band at $95.27 and then gravitate toward the 200-day EMA around $99–$100. A clean reclaim of the 200-day EMA would tilt the entire structure for Netflix stock back into a more clearly bullish regime.
Bearish Scenario: What Would Invalidate the Bullish Case?
In contrast, the bearish scenario focuses on the risk that the recent pullback is only the first leg of a deeper reset as investors reassess Netflix’s growth strategy after walking away from the Warner Bros. deal. If price loses the hourly and daily support zones near $91–$92 and starts closing below the daily S1 at $90.95, the neutral-to-bullish bias would break down.
A decisive drop toward the lower daily Bollinger band near $90, accompanied by a daily RSI breaking back below 50 and a MACD expanding deeper into negative territory, would signal renewed downside momentum. Under that pattern, rallies back into the low-mid $90s could turn into selling opportunities rather than bases for further gains in NFLX.
Outlook: Range-Bound Netflix Stock Awaiting a Catalyst
Overall, Netflix sits at an equilibrium point where news, valuation debate, and technicals are roughly balanced. Short-term volatility is moderate, with ATR readings showing enough range for active trading but no sign of panic. Until price breaks meaningfully above $96 or below $91 on a closing basis, positioning remains a game of managing a range rather than chasing trend. Market participants will likely focus on how Netflix stock digests the latest price hikes and strategic choices in the coming sessions, as those reactions will determine whether this current pause resolves into a new leg higher or a deeper correction.


You May Also Like
Trump 'like the dog who caught the car' as Americans blame him for economy: strategist

XRP To $10? Thesis Links CLARITY Act To Bank-Scale Liquidity