Cardano price analysis: ADA at $0.25 is cheap for a reason
ADA is grinding near the bottom of its range around $0.25 while the broader crypto market shows a modest rebound and extreme fear, shaping this Cardano price setup.
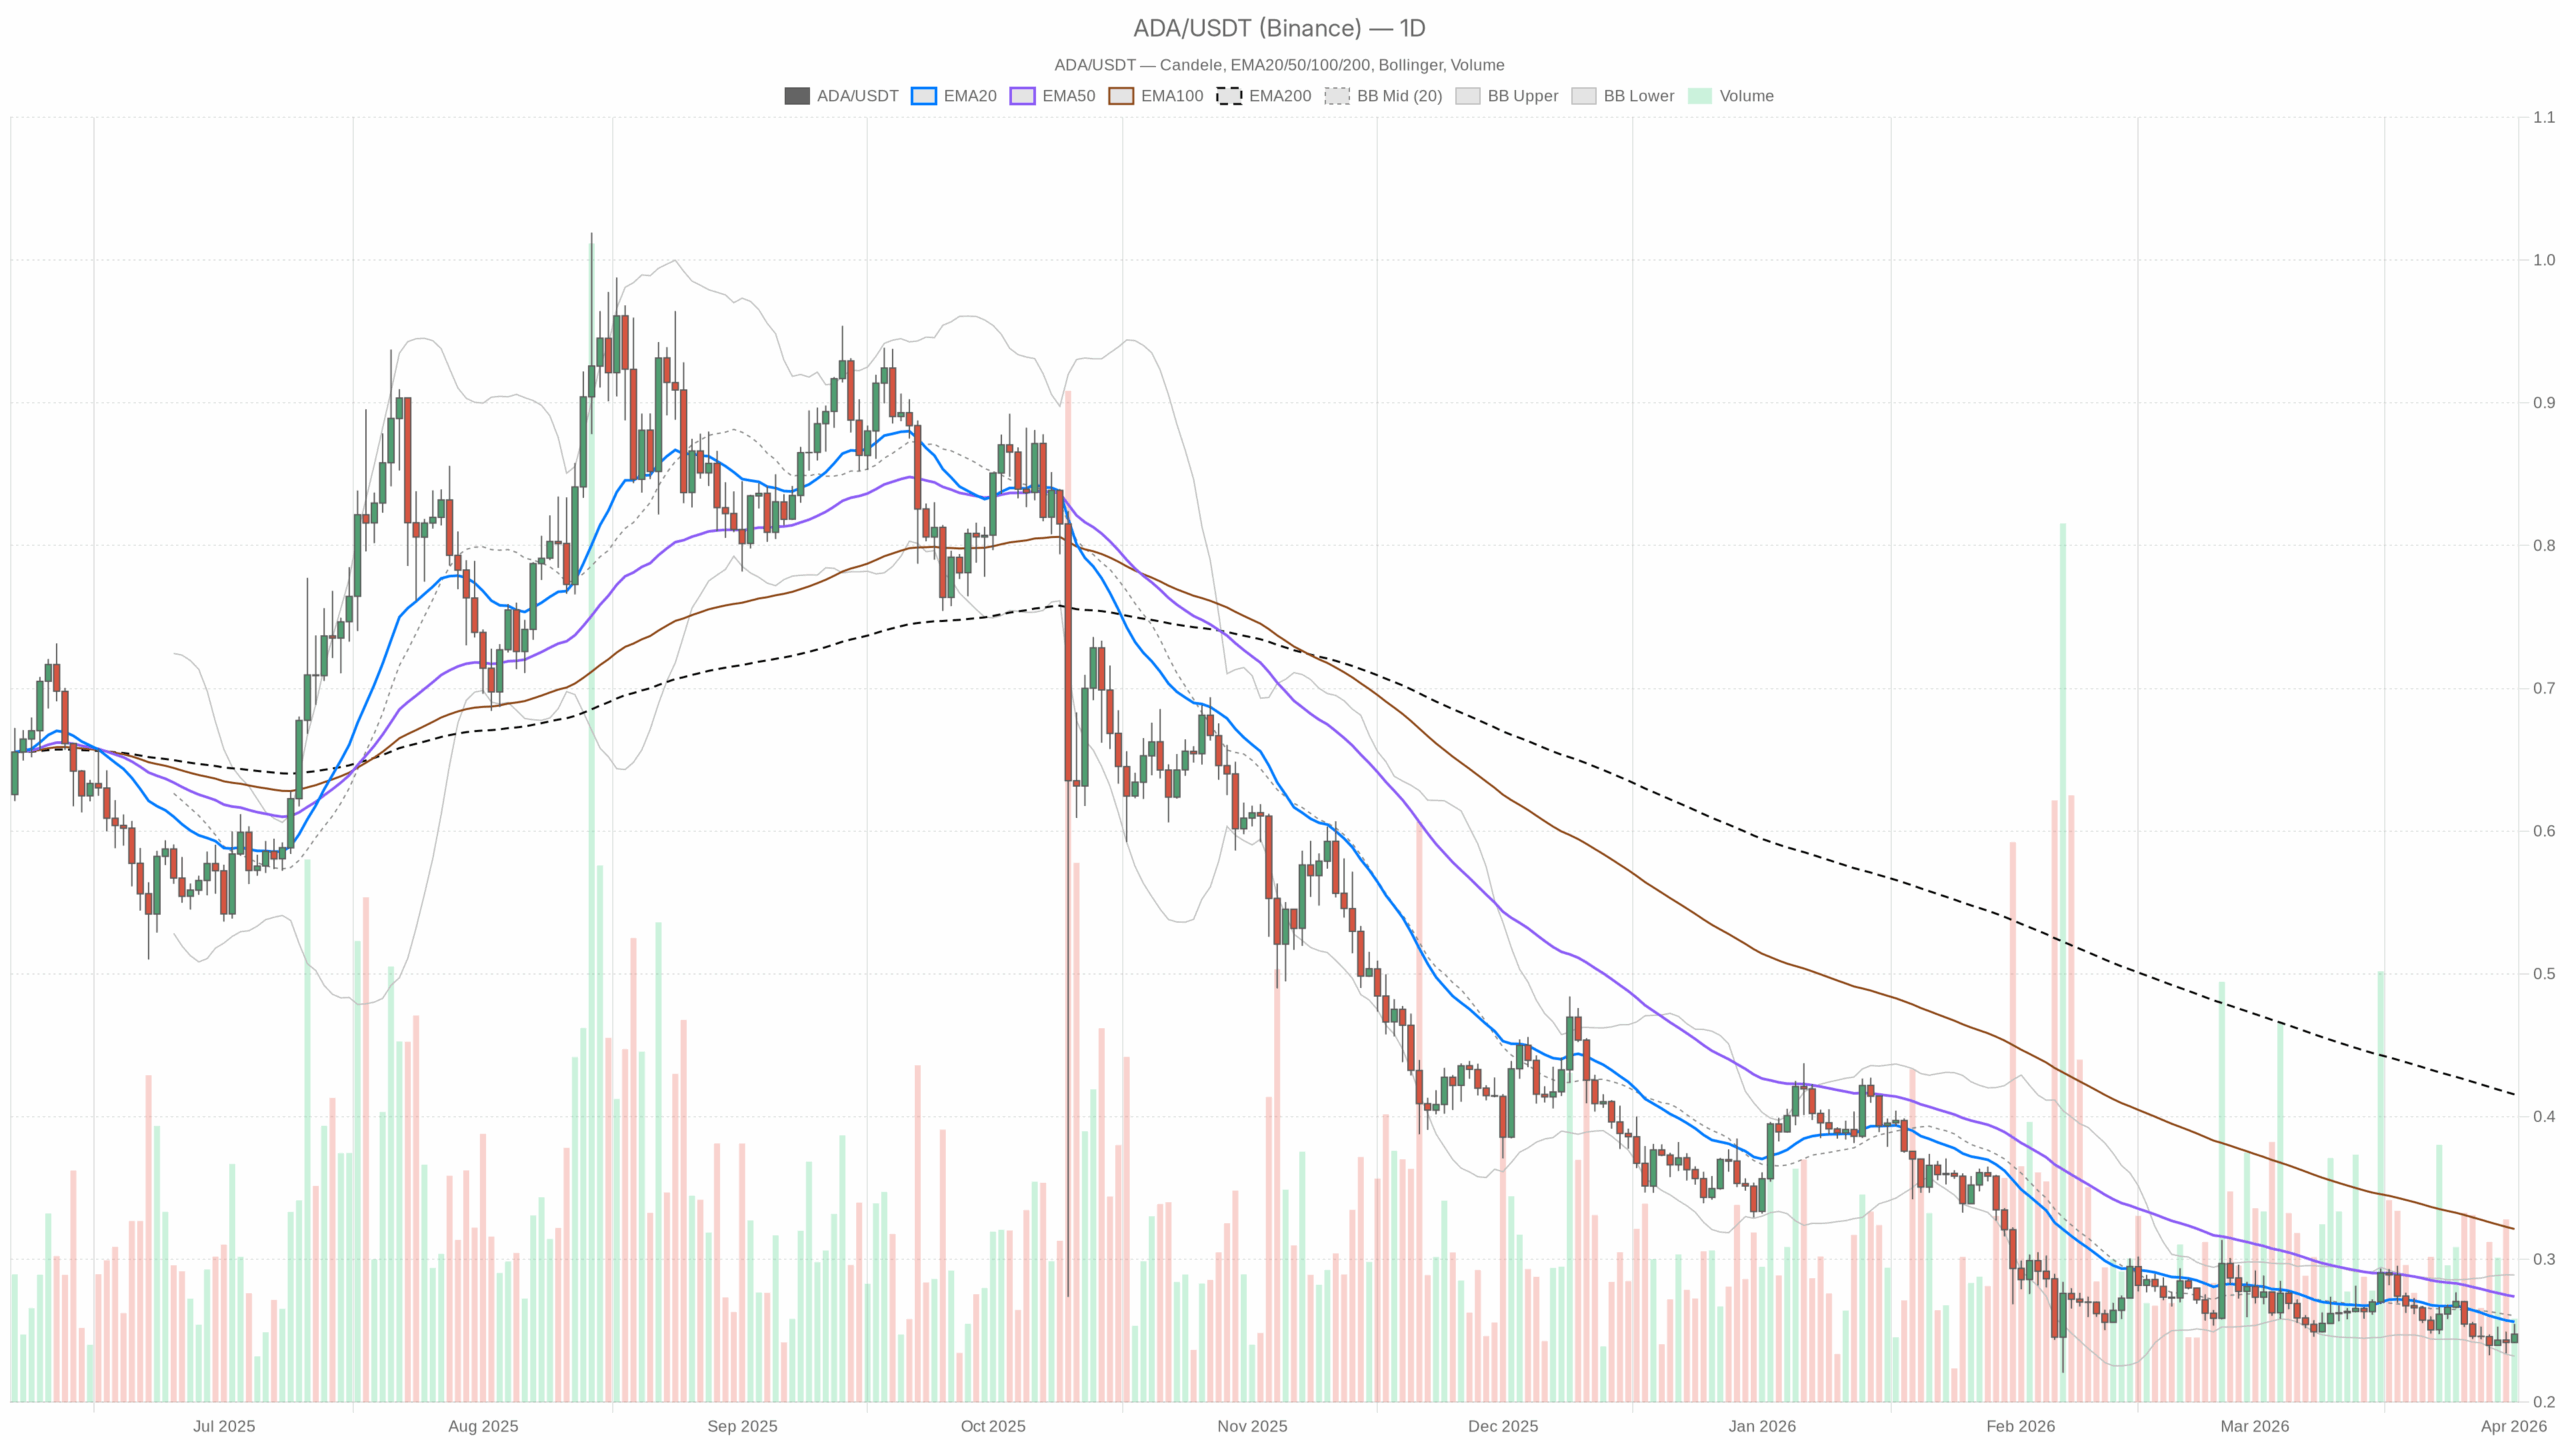 ADA/USDT — daily chart with candlesticks, EMA20/EMA50 and volume.
Daily Chart (D1): Core Bias – Still Bearish
On the daily timeframe, the regime is flagged as bearish. The moving average stack confirms this: price at $0.25 is below the 20-day EMA ($0.26), the 50-day EMA ($0.27), and well below the 200-day EMA ($0.42). That is a textbook downtrend structure with a long-term top already in the rear-view mirror.
RSI (Daily)
RSI 14 is at 42.89.
Interpretation: Momentum is weak but not yet oversold. ADA is in a soft bearish zone where sellers still dominate, but capitulation has not really kicked in. This is the kind of RSI level where bounces can occur. However, they usually struggle to become full trend reversals unless RSI pushes decisively back above 50–55 and holds there.
MACD (Daily)
MACD line -0.01, signal line -0.01, histogram around 0.
Interpretation: Bearish momentum has cooled off and is moving into a flat zone. The downside impulse is losing energy, but there is no convincing upside thrust either. This often precedes a consolidation phase after a down leg: less about trend reversal, more about the market catching its breath.
EMAs (Daily)
Price $0.25 vs EMA20 $0.26, EMA50 $0.27, EMA200 $0.42.
Interpretation: ADA is trading below all the key EMAs, with the 20 and 50-day acting as immediate dynamic resistance and the 200-day far above, signaling the bigger-cycle damage. Any bounce into the $0.26–0.27 band should be treated as a test of trend resistance, not proof of a new bull leg. The distance to the 200-day EMA around $0.42 underlines how much work is needed for a proper structural recovery.
Bollinger Bands (Daily)
Mid-band (20-day basis) at $0.26, upper band $0.29, lower band $0.23. Price is near the mid-to-lower area around $0.25.
Interpretation: ADA is hugging the lower half of the band set, consistent with a mild grind lower rather than a violent selloff. Volatility is present but not extreme. Moreover, the lower band near $0.23 is your obvious downside reference; as long as price oscillates between $0.23 and $0.26, this is a controlled downtrend rather than panic.
ATR (Daily)
ATR14 is about $0.01.
Interpretation: Daily volatility is modest relative to price. A $0.01 average daily move on a $0.25 asset is roughly 4%. That is active but not chaotic for crypto. It means moves will not be trivial, but the market is not in a blow-off or liquidation regime right now. Position sizing can be calibrated off that $0.01 daily range for risk management.
Daily Pivot Levels
Pivot point (PP) at $0.25, R1 at $0.25, S1 at $0.24.
Interpretation: The very tight clustering of pivot, R1, and price around $0.25 shows the market is balanced intraday around this level. Immediate support is essentially $0.24, while meaningful resistance is less about the pivot math and more about the nearby EMAs around $0.26–0.27.
Daily verdict: The main scenario is bearish. Trend structure and positioning of price versus EMAs back that up, even though momentum is not aggressively negative. This is a controlled downtrend with potential for short-covering bounces, not a confirmed bottom.
1-Hour Chart (H1): Short-Term Stabilization Against a Bearish Backdrop
The hourly timeframe shows a different tone: the regime is marked as neutral, and price at $0.25 is trading slightly above the short EMAs. That hints at a weak intraday bid trying to stabilize price within the larger downtrend.
RSI (1H)
RSI 14 on H1 is at 56.49.
Interpretation: Hourly momentum has shifted into the bullish half of the band. Buyers have the upper hand intraday, but this is not overbought or euphoric. It fits a scenario where shorts are easing off and dip buyers are probing, trying to defend the $0.24–0.25 zone.
MACD (1H)
MACD line ~0, signal ~0, histogram 0.
Interpretation: Momentum is neutral on the hourly. The immediate push off the lows has cooled, leaving ADA in a small equilibrium zone. That supports the idea of consolidation rather than a clean impulsive move up or down in the very near term.
EMAs (1H)
Price $0.25 vs EMA20 $0.24, EMA50 $0.24, EMA200 $0.25.
Interpretation: On the intraday scale, price has reclaimed the 20 and 50-hour EMAs and is sitting roughly on the 200-hour EMA. That usually means short-term balance following a selloff. Bulls have stopped the bleeding for now, but they have not yet turned the intraday structure into a decisive uptrend. Price is still wrestling with the longer intraday average.
Bollinger Bands (1H)
Mid-band at $0.24, upper band $0.25, lower band $0.24, with ADA trading very near the upper band at $0.25.
Interpretation: Price pressing the upper band while bands are fairly tight points to a gentle upward drift rather than an explosive breakout. Short term, that supports continuation of the grind higher toward daily resistance zones as long as $0.24 holds on pullbacks.
ATR (1H)
ATR14 on H1 is effectively 0 (very low).
Interpretation: Hourly volatility has collapsed, matching the tight bands and flat MACD. The market is pausing. Such compressions often precede a volatility expansion; the direction of the break will likely align more with the dominant daily trend unless a strong catalyst appears.
Hourly Pivot Levels
PP at $0.25, R1 at $0.25, S1 at $0.25.
Interpretation: The pivot math is nearly meaningless here because price, pivot, and first support or resistance are all clustered at the same level. The market is coiled around $0.25 with no clear intraday battle line beyond the broader $0.24 support band and $0.26 resistance zone from the daily EMAs.
Hourly verdict: H1 leans modestly bullish in momentum but is structurally neutral. It is a stabilization phase inside a larger daily downtrend.
15-Minute Chart (M15): Execution-Level Noise, Not a Signal
The 15-minute chart is neutral and mostly useful for timing entries and exits, not for defining bias.
RSI (15m)
RSI 14 at 50.5.
Interpretation: Micro timeframe momentum is perfectly balanced. There is no edge here beyond confirming chop.
MACD (15m)
MACD line, signal, and histogram all near 0.
Interpretation: Intrabar momentum is flat. The market is waiting for a push from larger timeframes; scalpers are trading noise.
EMAs (15m)
Price $0.25, EMA20 $0.25, EMA50 $0.25, EMA200 $0.24.
Interpretation: Short-term price is sitting directly on the fast and medium EMAs and slightly above the 200-EMA. That is a micro bullish tilt within a tight range, helpful only for fine-tuning entries inside the larger daily narrative.
Bollinger Bands (15m)
Mid-band at $0.25, upper band at $0.25, lower band $0.24.
Interpretation: Very tight intraday bands with price near the upper side again support the idea of small-scale upward drift but no strong trend.
ATR (15m)
ATR14 near 0.
Interpretation: Micro volatility is compressed. When this breaks, moves on the 15-minute chart will feel sharp, but the direction will likely be dictated by the hourly and, ultimately, the daily trend.
Market Context: Extreme Fear, But Not a Liquidity Crisis
The global crypto market cap is around $2.44T, up roughly 2.25% in 24 hours, and BTC dominance is high at about 56%. Meanwhile, the fear and greed index sits at 8 (Extreme Fear). That combination says investors are defensive, rotating to majors and away from speculative altcoins like ADA.
Interestingly, some Cardano DeFi activity (for example, Minswap, WingRiders, Danogo) shows sizable fee growth on a 7–30 day horizon, suggesting the ecosystem is not dead even as price lags. However, the market is not paying for that on the spot chart yet. Price action still treats ADA as a risk asset to underweight in a fearful macro tape.
Bullish Scenario for Cardano Price
For a constructive upside case, ADA needs to transition from short-term stabilization to actual trend repair. This would shift the balance of risk away from pure downside continuation.
What a bullish path looks like:
- ADA continues to hold above $0.24, defending the lower Bollinger Band on the daily chart and establishing this area as a local floor.
- On the daily timeframe, price reclaims and sustains above the 20-day EMA (~$0.26), then challenges the 50-day EMA (~$0.27). A daily close above $0.27 with follow-through would be the first serious signal that the downtrend is losing its grip.
- Daily RSI climbs from the current 43 area back above 50–55, confirming that the demand side is starting to dominate rather than just triggering short-covering spikes.
- MACD on D1 pushes its histogram back into positive territory and separates the MACD line from the signal line to the upside, reflecting a genuine momentum shift instead of flat consolidation.
In such a case, short-term targets would be the upper Bollinger Band near $0.29, followed by the more significant resistance zone toward $0.30–0.32. The 200-day EMA up near $0.42 is a much longer-term objective and will not be realistically in play until the market has spent time building a higher base.
What invalidates the bullish scenario: A decisive daily close below $0.24 with daily RSI slipping into the mid-30s would undercut the idea of a forming base and re-open the door to a deeper leg lower toward and potentially below the $0.23 lower band.
Bearish Scenario for Cardano Price
The bears still control the higher timeframe structure, so their scenario currently has the edge over any developing bullish case.
What a bearish continuation looks like:
- ADA fails repeatedly to reclaim and sustain above $0.26–0.27 (the daily 20 and 50 EMA cluster), turning these levels into a strong confluence ceiling.
- Hourly and 15-minute attempts higher fade close to $0.26, with H1 RSI rolling back under 50 and MACD turning negative again, signaling that intraday strength was only a brief bounce.
- Price breaks the $0.24 support, pushing daily closes toward or below the $0.23 lower Bollinger Band.
- Daily RSI drifts down toward or below 35, re-engaging a stronger bearish momentum regime.
In that scenario, the market shifts from controlled grind to renewed downside impulse. Volatility (ATR) on the daily would likely expand beyond $0.01 as range widens, and ADA could start hunting for new support deeper below $0.23, where historical price structure will matter more than the current indicator set.
What invalidates the bearish scenario: A sustained reclaim of the $0.27 area on the daily chart, combined with daily RSI pushing back above 50, would indicate that sellers can no longer hold the lower range. If ADA starts closing above the mid-Bollinger band ($0.26) and treating it as support, the narrative shifts decisively away from bearish continuation.
How to Think About Positioning Here
Right now, Cardano price action is defined by a bearish daily trend with neutral-to-mildly-bullish intraday stabilization. That tension often resolves in favor of the higher timeframe, especially in an environment of extreme fear and high BTC dominance. The risk is that the current calm is just a pause before another leg down.
For traders, the key battlegrounds are clear:
- $0.24–0.23 as the near-term downside band where loss of support would confirm trend continuation.
- $0.26–0.27 as the ceiling that must be broken on a daily closing basis to turn this from a bear rally into the early stages of a recovery.
Volatility is moderate on the daily and compressed intraday, which means both complacency and surprise risk are elevated. A volatility expansion is likely coming; timing it will depend on how price behaves around the mentioned levels. In this kind of setup, risk control and timeframe discipline matter more than conviction about direction. The market has clearly punished late bulls, but it has not yet rewarded aggressive dip-buyers either.
In summary, ADA looks cheap for a reason around current levels. Until the daily chart repairs above the 20 and 50 EMA cluster and RSI flips back into bullish territory, the burden of proof remains firmly on the bulls regarding the next decisive move in the Cardano price.


You May Also Like

New Hampshire to Issue $100M Bitcoin-Backed Bond With Speculative Moody’s Rating

Bitcoin at Crucial Pivot Point, Here's Why Fed Can Tilt Balance