TLDR Ethereum gained 8.84% this week, trading at $4,510 after strong price movement Whales accumulated nearly 800,000 ETH, showing growing institutional confidence Technical indicators point to potential targets of $5,000 to $5,200 if momentum continues Analysts compare ETH’s current pattern to gold’s 2020-2025 rally, suggesting $12,000-$15,000 possible by end of 2025 BlackRock’s Ethereum ETF and [...] The post Ethereum (ETH) Price: Whales Accumulate 800,000 ETH as Institutional Demand Grows appeared first on CoinCentral.TLDR Ethereum gained 8.84% this week, trading at $4,510 after strong price movement Whales accumulated nearly 800,000 ETH, showing growing institutional confidence Technical indicators point to potential targets of $5,000 to $5,200 if momentum continues Analysts compare ETH’s current pattern to gold’s 2020-2025 rally, suggesting $12,000-$15,000 possible by end of 2025 BlackRock’s Ethereum ETF and [...] The post Ethereum (ETH) Price: Whales Accumulate 800,000 ETH as Institutional Demand Grows appeared first on CoinCentral.

Ethereum (ETH) Price: Whales Accumulate 800,000 ETH as Institutional Demand Grows

2025/10/06 14:55
3 min read

TLDR

  • Ethereum gained 8.84% this week, trading at $4,510 after strong price movement
  • Whales accumulated nearly 800,000 ETH, showing growing institutional confidence
  • Technical indicators point to potential targets of $5,000 to $5,200 if momentum continues
  • Analysts compare ETH’s current pattern to gold’s 2020-2025 rally, suggesting $12,000-$15,000 possible by end of 2025
  • BlackRock’s Ethereum ETF and institutional products drove daily trading volume above $37 billion

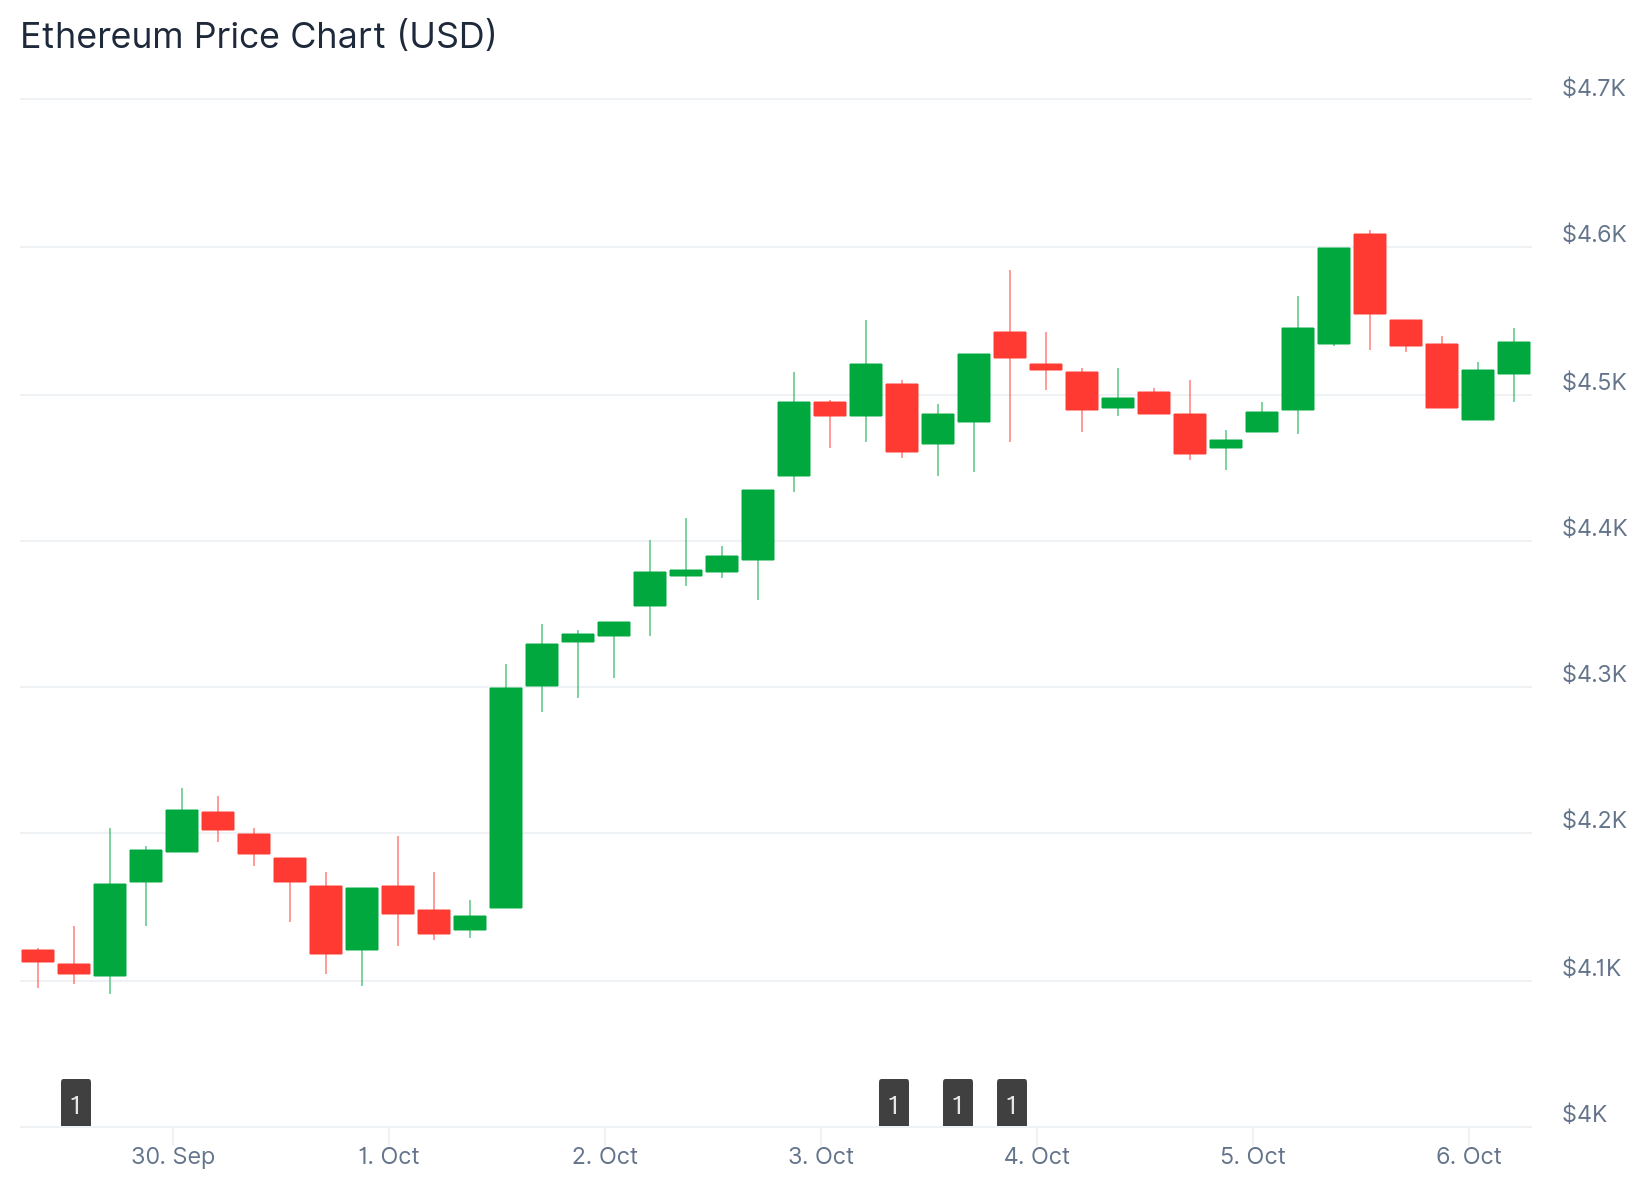
Ethereum ended the week trading at $4,510 after recording an 8.84% gain. The second-largest cryptocurrency by market capitalization showed strong price movement between $4,088 and $4,616.

Ethereum (ETH) PriceEthereum (ETH) Price

Whale activity increased during the week, with large holders purchasing just under 800,000 ETH. Data compiled by crypto market expert Ali revealed this accumulation pattern.

The buying activity suggests growing institutional interest in Ethereum’s future. This comes as the broader market stabilizes after several months of volatility.

Ethereum maintained trading above $4,100 throughout the week. This level appears to provide strong technical support for continued price movement.

The RSI level stands at 63.56, indicating positive buying momentum. Traders see room for further upside before the indicator enters overbought territory.

The MACD indicator shows the main line at 517.18, well above the signal line at 443.31. The widening gap with positive histogram readings indicates strong upward momentum continuing through October.

From a technical perspective, Fibonacci retracement levels outline potential targets for Ethereum. Resistance appears near $4,742, aligned with the 0.236 Fibonacci level.

A break above this range could open the path toward $4,950 and potentially $5,200. These levels represent areas where selling pressure may increase.

ETF Inflows Change Market Structure

The introduction of BlackRock’s Ethereum ETF and similar institutional products changed the market profile in 2025. These funds provide traditional investors with ETH exposure without direct custody concerns.

ETF inflows appear to reduce selling pressure among long-term holders. Analysts note this improves ETH price stability compared with earlier bull cycles.

Institutional portfolios now treat ETH as a diversification tool rather than purely speculative. Many analysts expect inflows to continue through the fourth quarter of 2025.

Market observers compared Ethereum’s current structure to gold’s multi-year climb. Trader DeFiTracer shared a chart showing Ethereum’s 2024-2026 pattern closely tracking gold’s 2020-2025 rise.

Blockchain Reporter data supported this comparison. The study showed the Ethereum-gold correlation rose to 0.7 in the third quarter of 2025, marking one of the strongest alignments recorded between the two assets.

Historically, Ethereum traded opposite gold, moving higher when investors sought risk. Analysts say changing macro conditions, especially inflation pressure and expanding ETF inflows, started to close that gap.

Analyst Forecasts Range from $12,000 to $15,000

Researchers including Benjamin Cowen and Tom Lee forecast that Ethereum could approach $12,000 to $15,000 if current inflows persist. They cite growing participation across decentralized finance and staking platforms.

These platforms encourage long-term holding of ETH rather than short-term speculation. The shift in holder behavior could support sustained price movement.

On-chain data shows the Spent Output Profit Ratio decreased for short-term holders. This metric measures whether coins are moving at a profit or loss.

Support levels remain at $4,120 for the first major floor, with deeper support at $3,850. If prices settle below these levels, Ethereum could return toward $3,500, though current momentum suggests this scenario is less likely.

The post Ethereum (ETH) Price: Whales Accumulate 800,000 ETH as Institutional Demand Grows appeared first on CoinCentral.

Market Opportunity
Ethereum Logo
Ethereum Price(ETH)
$2,090.42
$2,090.42$2,090.42
+5.55%
USD
Ethereum (ETH) Live Price Chart
Disclaimer: The articles reposted on this site are sourced from public platforms and are provided for informational purposes only. They do not necessarily reflect the views of MEXC. All rights remain with the original authors. If you believe any content infringes on third-party rights, please contact service@support.mexc.com for removal. MEXC makes no guarantees regarding the accuracy, completeness, or timeliness of the content and is not responsible for any actions taken based on the information provided. The content does not constitute financial, legal, or other professional advice, nor should it be considered a recommendation or endorsement by MEXC.

You May Also Like

Kraken's Big Hint: Pi Coin Set for Exchange Listing In 2026

Kraken's Big Hint: Pi Coin Set for Exchange Listing In 2026

Pi Coin (PI) is deeply embarked in the ongoing red light therapy that’s crunched the global crypto’s market capitalization below $2.4 trillion. The mobile mining
Share
Coinstats2026/02/07 09:25
US Stock Market Could Double By End Of Presidential Term

US Stock Market Could Double By End Of Presidential Term

The post US Stock Market Could Double By End Of Presidential Term appeared on BitcoinEthereumNews.com. Trump’s Bold Prediction: US Stock Market Could Double By
Share
BitcoinEthereumNews2026/02/07 10:43
Whales Dump 200 Million XRP in Just 2 Weeks – Is XRP’s Price on the Verge of Collapse?

Whales Dump 200 Million XRP in Just 2 Weeks – Is XRP’s Price on the Verge of Collapse?

Whales offload 200 million XRP leaving market uncertainty behind. XRP faces potential collapse as whales drive major price shifts. Is XRP’s future in danger after massive sell-off by whales? XRP’s price has been under intense pressure recently as whales reportedly offloaded a staggering 200 million XRP over the past two weeks. This massive sell-off has raised alarms across the cryptocurrency community, as many wonder if the market is on the brink of collapse or just undergoing a temporary correction. According to crypto analyst Ali (@ali_charts), this surge in whale activity correlates directly with the price fluctuations seen in the past few weeks. XRP experienced a sharp spike in late July and early August, but the price quickly reversed as whales began to sell their holdings in large quantities. The increased volume during this period highlights the intensity of the sell-off, leaving many traders to question the future of XRP’s value. Whales have offloaded around 200 million $XRP in the last two weeks! pic.twitter.com/MiSQPpDwZM — Ali (@ali_charts) September 17, 2025 Also Read: Shiba Inu’s Price Is at a Tipping Point: Will It Break or Crash Soon? Can XRP Recover or Is a Bigger Decline Ahead? As the market absorbs the effects of the whale offload, technical indicators suggest that XRP may be facing a period of consolidation. The Relative Strength Index (RSI), currently sitting at 53.05, signals a neutral market stance, indicating that XRP could move in either direction. This leaves traders uncertain whether the XRP will break above its current resistance levels or continue to fall as more whales sell off their holdings. Source: Tradingview Additionally, the Bollinger Bands, suggest that XRP is nearing the upper limits of its range. This often points to a potential slowdown or pullback in price, further raising concerns about the future direction of the XRP. With the price currently around $3.02, many are questioning whether XRP can regain its footing or if it will continue to decline. The Aftermath of Whale Activity: Is XRP’s Future in Danger? Despite the large sell-off, XRP is not yet showing signs of total collapse. However, the market remains fragile, and the price is likely to remain volatile in the coming days. With whales continuing to influence price movements, many investors are watching closely to see if this trend will reverse or intensify. The coming weeks will be critical for determining whether XRP can stabilize or face further declines. The combination of whale offloading and technical indicators suggest that XRP’s price is at a crossroads. Traders and investors alike are waiting for clear signals to determine if the XRP will bounce back or continue its downward trajectory. Also Read: Metaplanet’s Bold Move: $15M U.S. Subsidiary to Supercharge Bitcoin Strategy The post Whales Dump 200 Million XRP in Just 2 Weeks – Is XRP’s Price on the Verge of Collapse? appeared first on 36Crypto.
Share
Coinstats2025/09/17 23:42