Ethereum (ETH) is up 5% on Monday, showing signs of recovery amid reports that Iran has launched missiles at a United States (US) military base in Qatar. The geopolitical tensions sparked an increase in ETH volatility, resulting in a rise in realized profits and losses over the weekend.Ethereum (ETH) is up 5% on Monday, showing signs of recovery amid reports that Iran has launched missiles at a United States (US) military base in Qatar. The geopolitical tensions sparked an increase in ETH volatility, resulting in a rise in realized profits and losses over the weekend.

Ethereum Price Forecast: ETH eyes recovery as Israel-Iran conflict spills into US military base

2025/06/24 04:10
3 min read
For feedback or concerns regarding this content, please contact us at crypto.news@mexc.com

Ethereum price today: $2,300

  • Ethereum experienced a surge in volatility following the US involvement in the Israel-Iran conflict over the weekend.
  • Ethereum investors have booked $750 million in combined realized profits and losses since the market began declining on Friday.
  • ETH found support at $2,110, near the lower boundary of a broader symmetrical triangle and the 100-day SMA.

Ethereum (ETH) is up 5% on Monday, showing signs of recovery amid reports that Iran has launched missiles at a United States (US) military base in Qatar. The geopolitical tensions sparked an increase in ETH volatility, resulting in a rise in realized profits and losses over the weekend.

Ethereum volatility and short-term holders selling spikes amid recovery signs

Ethereum briefly retreated from $2,300 but quickly bounced back after Iran reportedly launched missiles at a US military base in Qatar, according to Axios. The strike comes as a retaliation for the US attack on three Iranian nuclear sites over the weekend — a move that pushed ETH toward $2,100.

"The market remains at an inflection point, with digital assets straddling the line between risk-on momentum and risk-off defensiveness amid ongoing geopolitical uncertainty," wrote QCP analysts in a Monday note.

Most ETH long traders bore the consequences of the sustained price drop, with long liquidations reaching nearly $600 million since Friday, according to Coinglass data.

The price decline also saw investors booking about $500 million in realized profits and over $250 million in losses from their selling activity during the same period. The selling was spearheaded by short-term holders, as evidenced by the sharp plunge in the 90 and 180-day Mean Coin Age. A drop in the Mean Coin Age across the different age cohorts represents a rising distribution and vice versa for an increase.

ETH Network Realized Profit/Loss & Mean Coin Age. Source: Santiment

"ETH's drawdown [has] been accompanied by a 15-point jump in 7-day implied volatility (IV) to 83%, reflecting increased downside hedging and uncertainty," wrote Sean Dawson, Head of Research at crypto options exchange Derive, in a note to investors on Monday.

"The surge in short-dated IV [...] confirms the market is bracing for more instability. Volatility markets are telling us this isn't over."

However, investors on the spot market are buying the dip at a modest pace, with three consecutive days of exchange net outflows reaching nearly 110,000 ETH on Monday, according to CryptoQuant's data.

US spot Ethereum ETFs also stretched their weekly inflow streak, recording $124 million in a ninth consecutive week of net inflows, according to a CoinShares report on Monday.

Outflows in crypto exchanges represent buying and vice versa for inflows. In exchange-traded funds (ETFs), the reverse is true.

Ethereum Price Forecast: ETH finds support at $2,110, eyes recovery

After breaking below the lower boundary of a smaller symmetrical triangle and the 50-day Exponential Moving Average (EMA) on Friday, ETH declined over 10% during the weekend. It eventually bounced off the $2,110 key support level near the lower boundary of a broader symmetrical triangle and the 100-day Simple Moving Average (SMA).

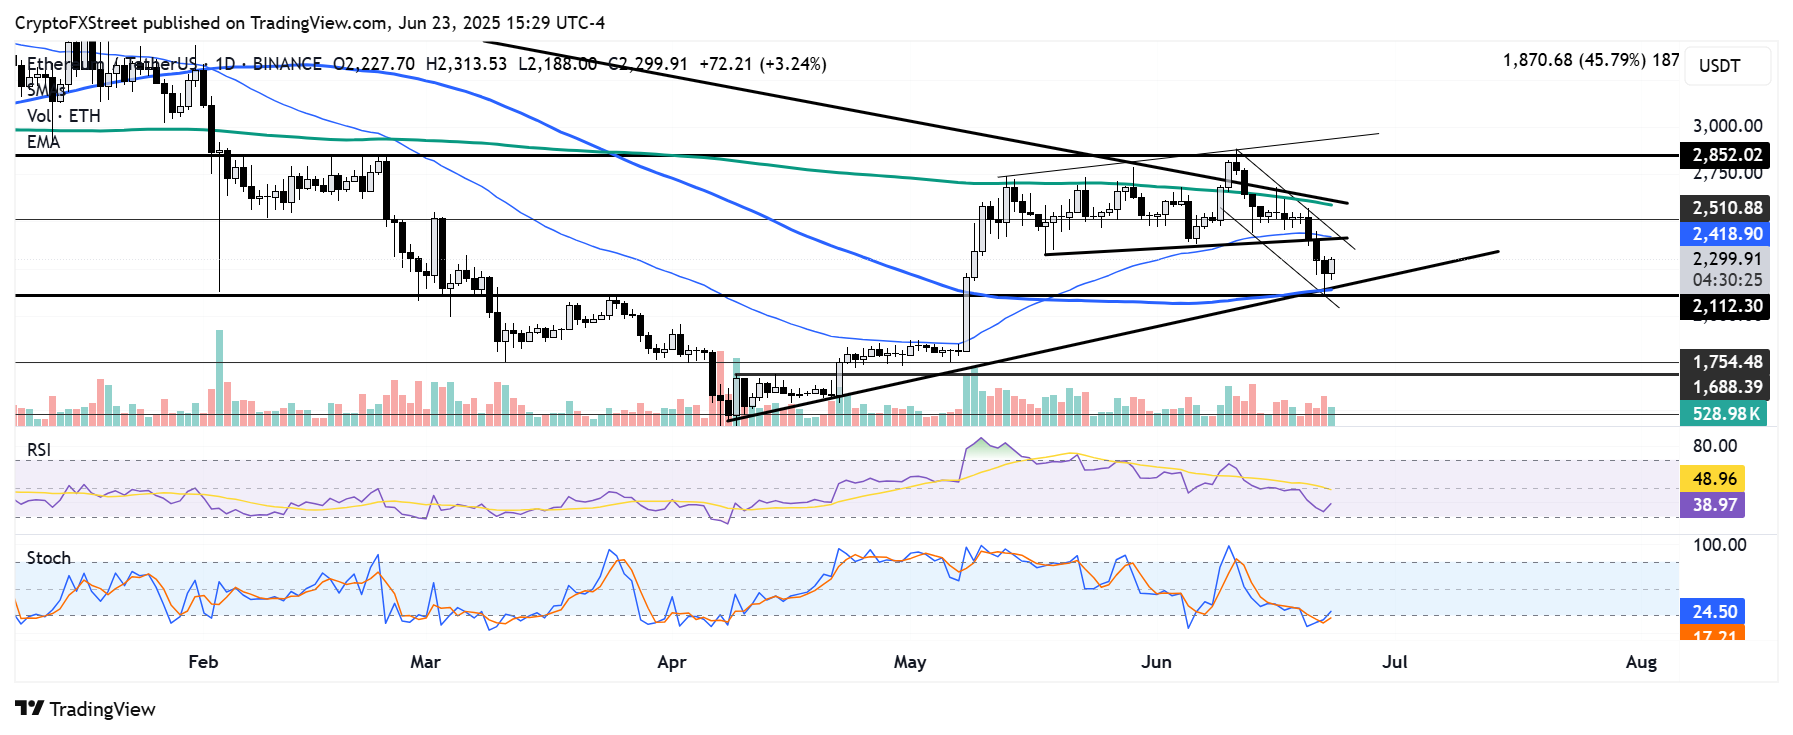
ETH/USDT daily chart

If ETH stages a recovery and flips the upper boundary of a descending channel, it could retest the resistance near $2,500. A successful move above this resistance could see ETH rise toward the $2,850 level.

On the downside, ETH could decline further toward $1,800 if it fails to hold the $2,110 key support level.

The Relative Strength Index (RSI) and Stochastic Oscillator (Stoch) are below their neutral levels but trending upward, indicating a slowdown in bearish momentum.


Market Opportunity
Ethereum Logo
Ethereum Price(ETH)
$2,170.28
$2,170.28$2,170.28
+3.65%
USD
Ethereum (ETH) Live Price Chart
Disclaimer: The articles reposted on this site are sourced from public platforms and are provided for informational purposes only. They do not necessarily reflect the views of MEXC. All rights remain with the original authors. If you believe any content infringes on third-party rights, please contact crypto.news@mexc.com for removal. MEXC makes no guarantees regarding the accuracy, completeness, or timeliness of the content and is not responsible for any actions taken based on the information provided. The content does not constitute financial, legal, or other professional advice, nor should it be considered a recommendation or endorsement by MEXC.

You May Also Like

4 Web3 Games That Will Be on Serious Rotation This Fall

4 Web3 Games That Will Be on Serious Rotation This Fall

Pudgy Party, Pixels, EVE Frontier, and The Beacon headline fall’s web3 gaming season with strong communities, token rewards, and polished gameplay that keeps players engaged.
Share
Blockchainreporter2025/09/18 22:08
Crypto Investors Who Made Millions WithShiba Inu, Are Now Rotating To Pepeto

Crypto Investors Who Made Millions WithShiba Inu, Are Now Rotating To Pepeto

It now sits above $115,000, a reminder that life-changing runs usually start before the crowd shows up. So the question […] The post Crypto Investors Who Made Millions WithShiba Inu, Are Now Rotating To Pepeto appeared first on Coindoo.
Share
Coindoo2025/09/18 22:39
BTC Leverage Builds Near $120K, Big Test Ahead

BTC Leverage Builds Near $120K, Big Test Ahead

The post BTC Leverage Builds Near $120K, Big Test Ahead appeared on BitcoinEthereumNews.com. Key Insights: Heavy leverage builds at $118K–$120K, turning the zone into Bitcoin’s next critical resistance test. Rejection from point of interest with delta divergences suggests cooling momentum after the recent FOMC-driven spike. Support levels at $114K–$115K may attract buyers if BTC fails to break above $120K. BTC Leverage Builds Near $120K, Big Test Ahead Bitcoin was trading around $117,099, with daily volume close to $59.1 billion. The price has seen a marginal 0.01% gain over the past 24 hours and a 2% rise in the past week. Data shared by Killa points to heavy leverage building between $118,000 and $120,000. Heatmap charts back this up, showing dense liquidity bands in that zone. Such clusters of orders often act as magnets for price action, as markets tend to move where liquidity is stacked. Price Action Around the POI Analysis from JoelXBT highlights how Bitcoin tapped into a key point of interest (POI) during the recent FOMC-driven spike. This move coincided with what was called the “zone of max delta pain”, a level where aggressive volume left imbalances in order flow. Source: JoelXBT /X Following the test of this area, BTC faced rejection and began to pull back. Delta indicators revealed extended divergences, with price rising while buyer strength weakened. That mismatch suggests demand failed to keep up with the pace of the rally, leaving room for short-term cooling. Resistance and Support Levels The $118K–$120K range now stands as a major resistance band. A clean move through $120K could force leveraged shorts to cover, potentially driving further upside. On the downside, smaller liquidity clusters are visible near $114K–$115K. If rejection holds at the top, these levels are likely to act as the first supports where buyers may attempt to step in. Market Outlook Bitcoin’s next decisive move will likely form around the…
Share
BitcoinEthereumNews2025/09/18 16:40