Buy Crypto
Markets
Spot
FuturesBTC
Earn
Event Center
Rewards Hub
More
How to Use DBCD in U.S. Stock Trading: A Complete Beginner's GuideHow to Use DBCD in U.S. Stock Trading: A Complete Beginner's Guide
Category List
Cancel

How to Use DBCD in U.S. Stock Trading: A Complete Beginner's Guide

Key Takeaways:

  • DBCD is a trend indicator derived from the Bias Ratio (BIAS), with smoother lines and clearer signals.
  • DBCD calculates and smooths the differences between BIAS values across periods, helping filter out short-term market noise.
  • Golden crosses and death crosses are commonly used DBCD trading signals, while its position relative to the zero line helps assess bullish and bearish momentum.
  • Bearish and bullish divergence may help identify potential price tops and bottoms.
  • MEXC users can combine DBCD with volume indicators and other tools to make more informed trading decisions.

1. What Is the DBCD Indicator?


Bias Convergence Diverge (DBCD) is a momentum-based technical indicator derived from the Bias Ratio (BIAS). It shares similar principles, construction methods, and applications with BIAS. By combining moving averages with exponential smoothing, DBCD measures the differences between BIAS values across periods to help identify underlying price momentum and potential trend reversals.

Compared with traditional BIAS, DBCD aims to stay closely aligned with price movements while producing smoother lines and clearer signals. This helps reduce the market noise caused by short-term fluctuations. For users new to technical analysis, its smoother readings can make DBCD a relatively accessible starting point.

2. Key DBCD Trading Signals: Golden Crosses and Death Crosses


A golden cross occurs when the faster DBCD line crosses above the slower signal line. It is generally considered a potential buy signal, suggesting that bullish momentum may be gaining strength. When it occurs near or below the zero line, it may provide a stronger indication of a potential trend reversal.

A death cross occurs when the faster DBCD line crosses below the signal line. It is generally considered a potential sell signal, suggesting that bearish pressure is increasing and bullish momentum is fading. When it occurs above the zero line, traders should pay closer attention to the possibility of a price top and subsequent pullback.

The zero line is also an important reference point. When DBCD stays above zero and the price remains above a key moving average, this may indicate an ongoing uptrend, during which traders may consider holding their positions in line with the trend. Conversely, a prolonged period below zero may suggest that a bearish trend is continuing.

3. Using Convergence and Divergence to Identify Potential Tops and Bottoms


Divergence is one of DBCD's key applications. Bearish divergence occurs when the price makes higher highs during an uptrend, while DBCD forms progressively lower peaks and moves back toward zero. This suggests that the underlying bullish momentum is weakening and may warn of a potential price top, prompting traders to consider reducing their positions. Bullish divergence is the opposite: the price makes lower lows during a downtrend, while DBCD gradually rises toward zero. This may indicate a shift in the balance between buying and selling pressure, with bearish momentum weakening and a potential bottom approaching.

Even when bullish divergence appears in a clear downtrend, traders considering a potential bottom should use small positions and keep return expectations modest. If the price encounters resistance at a key moving average or DBCD forms a death cross, consider taking profits rather than waiting for a larger rebound.

4. How to Add DBCD to a U.S. Stock Chart on MEXC


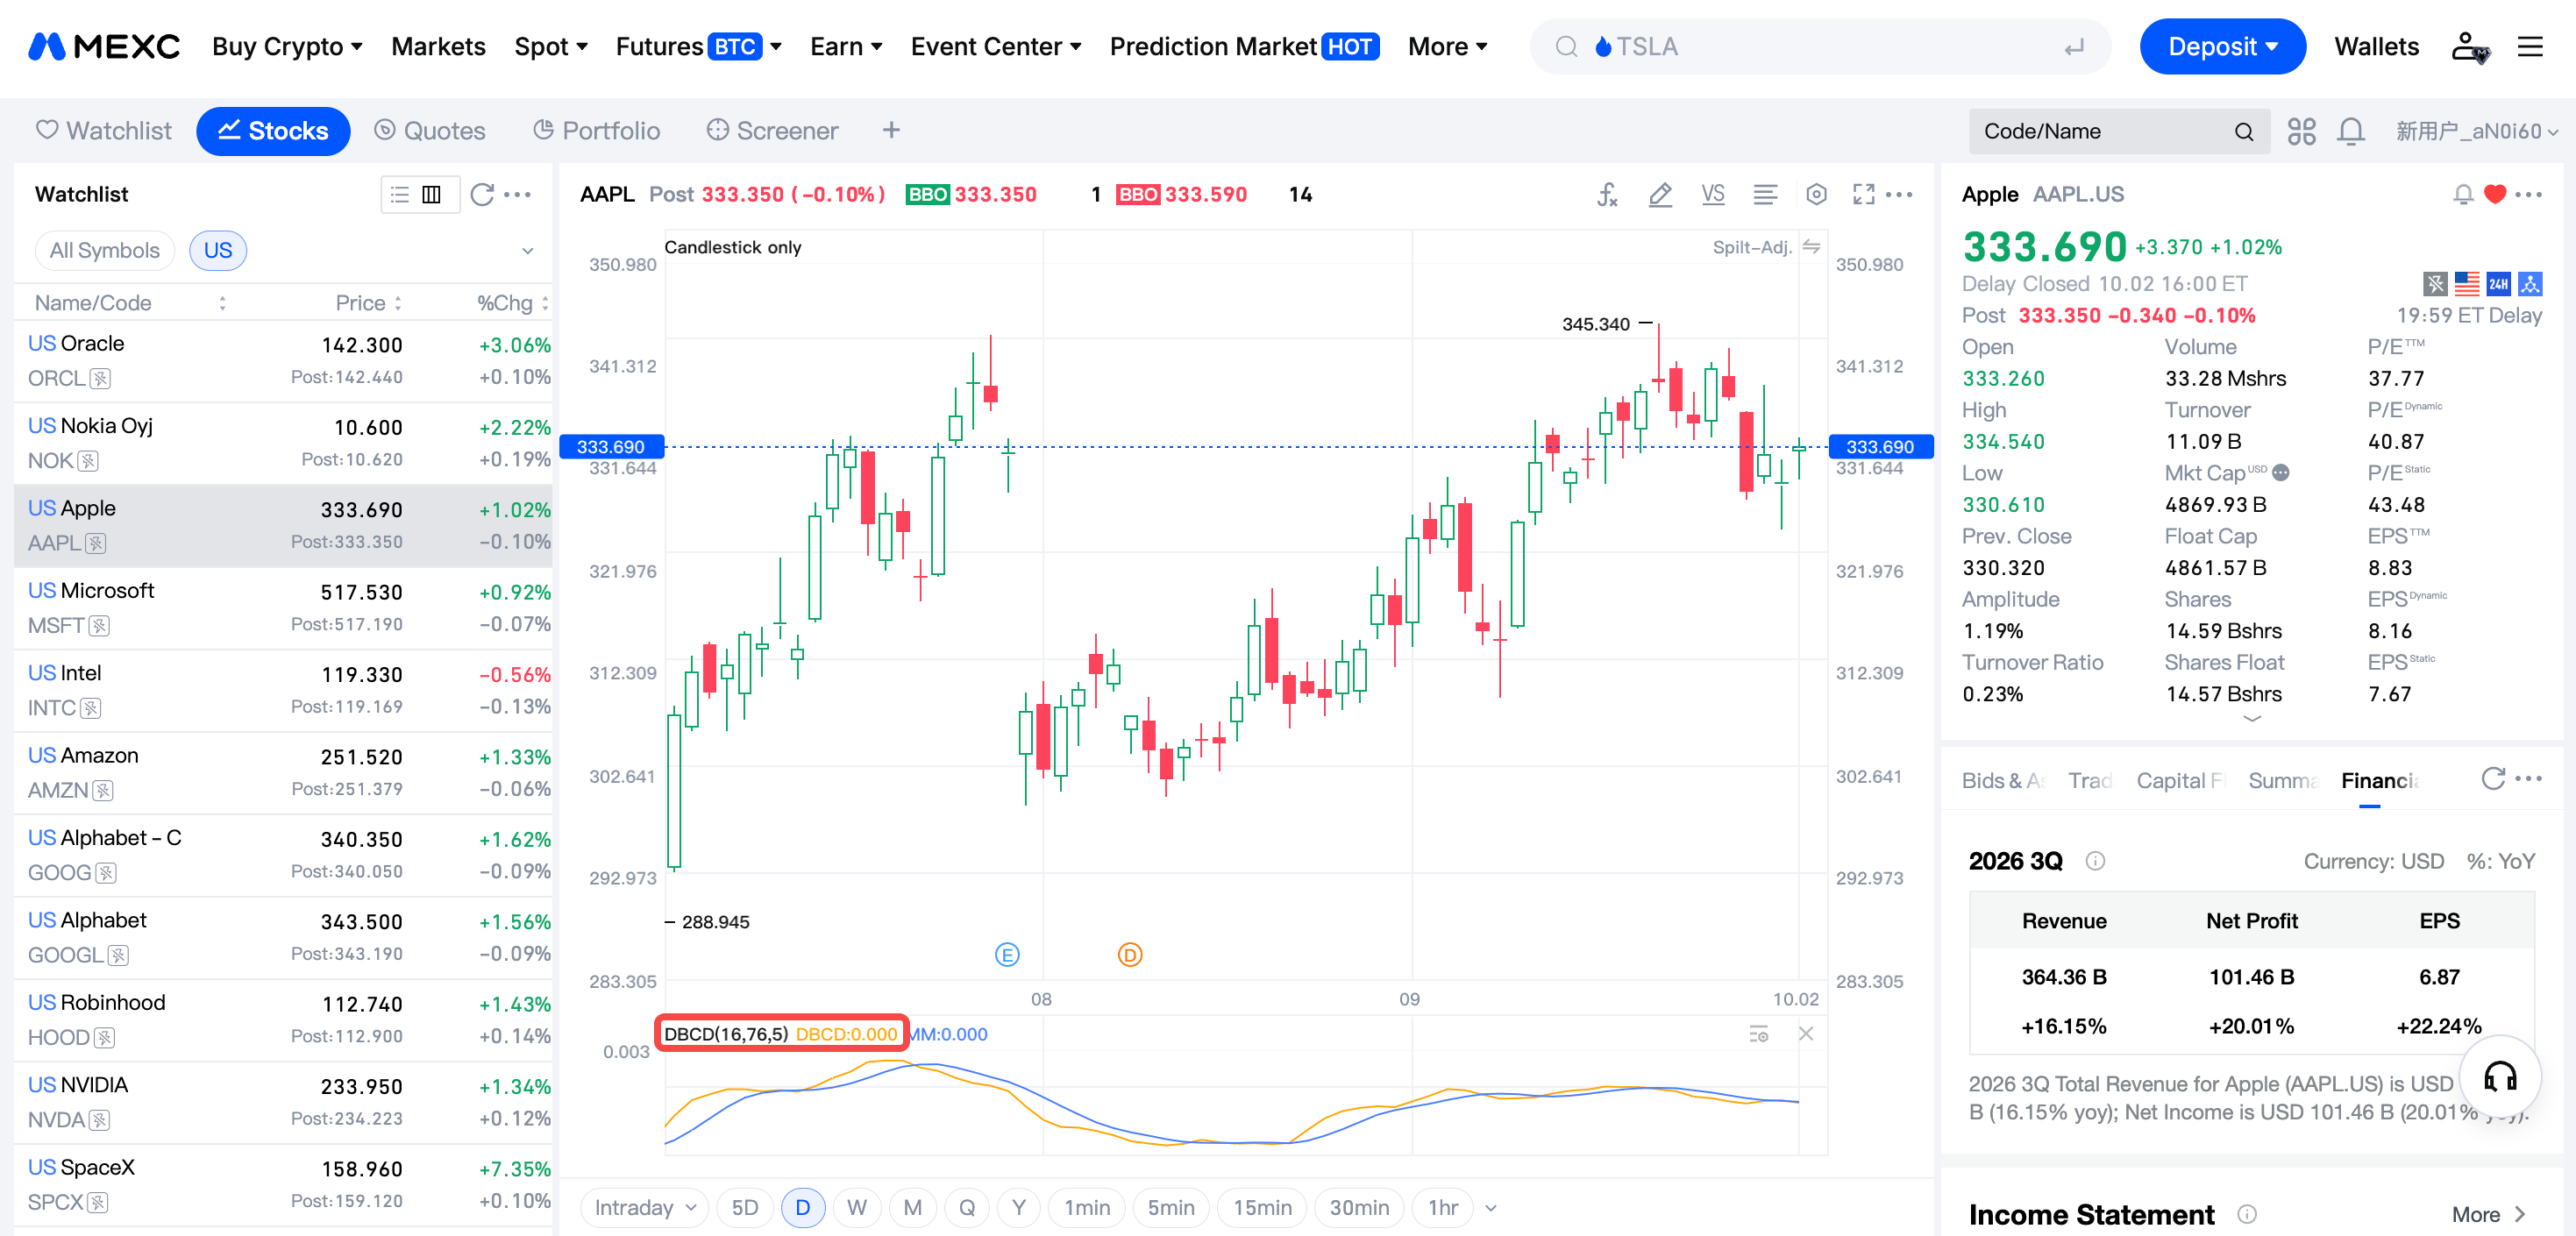
MEXC's U.S. stock trading charts support adding and configuring DBCD. Follow these steps:

1) Log in to your account, go to the U.S. stock trading page, and open the price chart for your chosen stock.

2) Click the indicator button above the chart. In the Indicator Loading panel, search for and select DBCD.

3) Once the indicator is added, adjust the period parameters to suit your trading preferences. The chart will display the indicator lines automatically. Beginners are advised to start with the default settings on the daily chart and become familiar with the indicator before customizing its parameters.


5. Practical Tips for Using DBCD


When using DBCD, beginners should keep the following points in mind:

1) DBCD is a smoothed indicator and therefore has some lag. During sharp price moves or prolonged sideways trading, it may produce delayed or misleading crossover signals. Use volume indicators and the Relative Strength Index (RSI) for additional confirmation.

2) DBCD golden crosses and death crosses may be more useful in bearish or range-bound markets. In strongly directional markets, a trend-following approach should take priority.

3) Signals on daily and weekly charts tend to be more reliable than those on shorter timeframes. They can help identify broader price trends and filter out intraday market noise.

4) No single indicator can guarantee profits. Appropriate position sizing and stop-loss orders remain fundamental to risk management.

6. DBCD FAQ


6.1 What is the DBCD indicator?


DBCD is a trend indicator derived from BIAS. It calculates the differences between BIAS values across periods and applies exponential smoothing to help identify price trends and potential reversals.

6.2 What do convergence and divergence mean in technical analysis?


Convergence refers to the indicator and price moving more closely together or to a narrowing difference between the values being compared. In the context of DBCD moving toward zero, this may suggest that momentum is weakening. Divergence occurs when the price and indicator move in different directions, which may signal a potential trend reversal.

6.3 How can I assess the degree of convergence?


Observe how quickly and how far DBCD moves back toward zero. The closer it gets to zero, with progressively smaller peaks and troughs, the greater the convergence and the weaker the momentum behind the existing trend may be.

6.4 What does BIAS convergence mean?


BIAS convergence means that the gap between the price and its moving average is gradually narrowing. This indicates that the price is moving back toward its average and that short-term overbought or oversold conditions are easing.

6.5 How can I assess the reliability of a divergence signal?


A divergence signal can fail on its own. Check it against changes in volume, the price's position relative to key moving averages, and the trend on higher timeframes. Agreement between multiple signals may provide stronger confirmation.

6.6 Which market conditions is DBCD suited to?


DBCD golden crosses and death crosses may be more useful in bearish or range-bound markets. In trending markets, its position relative to zero and its divergence signals are better suited to assessing whether a trend is continuing or losing momentum.

How to Use DBCD in U.S. Stock Trading: A Complete Beginner's Guide

Key Takeaways:

  • DBCD is a trend indicator derived from the Bias Ratio (BIAS), with smoother lines and clearer signals.
  • DBCD calculates and smooths the differences between BIAS values across periods, helping filter out short-term market noise.
  • Golden crosses and death crosses are commonly used DBCD trading signals, while its position relative to the zero line helps assess bullish and bearish momentum.
  • Bearish and bullish divergence may help identify potential price tops and bottoms.
  • MEXC users can combine DBCD with volume indicators and other tools to make more informed trading decisions.

1. What Is the DBCD Indicator?


Bias Convergence Diverge (DBCD) is a momentum-based technical indicator derived from the Bias Ratio (BIAS). It shares similar principles, construction methods, and applications with BIAS. By combining moving averages with exponential smoothing, DBCD measures the differences between BIAS values across periods to help identify underlying price momentum and potential trend reversals.

Compared with traditional BIAS, DBCD aims to stay closely aligned with price movements while producing smoother lines and clearer signals. This helps reduce the market noise caused by short-term fluctuations. For users new to technical analysis, its smoother readings can make DBCD a relatively accessible starting point.


2. Key DBCD Trading Signals: Golden Crosses and Death Crosses


A golden cross occurs when the faster DBCD line crosses above the slower signal line. It is generally considered a potential buy signal, suggesting that bullish momentum may be gaining strength. When it occurs near or below the zero line, it may provide a stronger indication of a potential trend reversal.

A death cross occurs when the faster DBCD line crosses below the signal line. It is generally considered a potential sell signal, suggesting that bearish pressure is increasing and bullish momentum is fading. When it occurs above the zero line, traders should pay closer attention to the possibility of a price top and subsequent pullback.

The zero line is also an important reference point. When DBCD stays above zero and the price remains above a key moving average, this may indicate an ongoing uptrend, during which traders may consider holding their positions in line with the trend. Conversely, a prolonged period below zero may suggest that a bearish trend is continuing.

3. Using Convergence and Divergence to Identify Potential Tops and Bottoms


Divergence is one of DBCD's key applications. Bearish divergence occurs when the price makes higher highs during an uptrend, while DBCD forms progressively lower peaks and moves back toward zero. This suggests that the underlying bullish momentum is weakening and may warn of a potential price top, prompting traders to consider reducing their positions. Bullish divergence is the opposite: the price makes lower lows during a downtrend, while DBCD gradually rises toward zero. This may indicate a shift in the balance between buying and selling pressure, with bearish momentum weakening and a potential bottom approaching.

Even when bullish divergence appears in a clear downtrend, traders considering a potential bottom should use small positions and keep return expectations modest. If the price encounters resistance at a key moving average or DBCD forms a death cross, consider taking profits rather than waiting for a larger rebound.

4. How to Add DBCD to a U.S. Stock Chart on MEXC


MEXC's U.S. stock trading charts support adding and configuring DBCD. Follow these steps:

1) Log in to your account, go to the U.S. stock trading page, and open the price chart for your chosen stock.

2) Click the indicator button above the chart. In the Indicator Loading panel, search for and select DBCD.

3) Once the indicator is added, adjust the period parameters to suit your trading preferences. The chart will display the indicator lines automatically. Beginners are advised to start with the default settings on the daily chart and become familiar with the indicator before customizing its parameters.


5. Practical Tips for Using DBCD


When using DBCD, beginners should keep the following points in mind:

1) DBCD is a smoothed indicator and therefore has some lag. During sharp price moves or prolonged sideways trading, it may produce delayed or misleading crossover signals. Use volume indicators and the Relative Strength Index (RSI) for additional confirmation.

2) DBCD golden crosses and death crosses may be more useful in bearish or range-bound markets. In strongly directional markets, a trend-following approach should take priority.

3) Signals on daily and weekly charts tend to be more reliable than those on shorter timeframes. They can help identify broader price trends and filter out intraday market noise.

4) No single indicator can guarantee profits. Appropriate position sizing and stop-loss orders remain fundamental to risk management.

6. DBCD FAQ


6.1 What is the DBCD indicator?


DBCD is a trend indicator derived from BIAS. It calculates the differences between BIAS values across periods and applies exponential smoothing to help identify price trends and potential reversals.

6.2 What do convergence and divergence mean in technical analysis?


Convergence refers to the indicator and price moving more closely together or to a narrowing difference between the values being compared. In the context of DBCD moving toward zero, this may suggest that momentum is weakening. Divergence occurs when the price and indicator move in different directions, which may signal a potential trend reversal.

6.3 How can I assess the degree of convergence?


Observe how quickly and how far DBCD moves back toward zero. The closer it gets to zero, with progressively smaller peaks and troughs, the greater the convergence and the weaker the momentum behind the existing trend may be.

6.4 What does BIAS convergence mean?


BIAS convergence means that the gap between the price and its moving average is gradually narrowing. This indicates that the price is moving back toward its average and that short-term overbought or oversold conditions are easing.

6.5 How can I assess the reliability of a divergence signal?


A divergence signal can fail on its own. Check it against changes in volume, the price's position relative to key moving averages, and the trend on higher timeframes. Agreement between multiple signals may provide stronger confirmation.

6.6 Which market conditions is DBCD suited to?


DBCD golden crosses and death crosses may be more useful in bearish or range-bound markets. In trending markets, its position relative to zero and its divergence signals are better suited to assessing whether a trend is continuing or losing momentum.