

How to Use DDI in U.S. Stock Trading: A Complete Beginner's Guide
Key Takeaways:
- Direction Standard Deviation Index or "Directional Deviation Index" (DDI) compares upward and downward price movements relative to the previous trading day to help identify trend direction.
- DDI is calculated using changes in price highs and lows, upward directional movement, and downward directional movement.
- A move in DDI from negative to positive may indicate a potential buying opportunity, while a move from positive to negative may indicate a potential selling opportunity.
- DDI can be combined with moving averages and relative strength indicators to help assess U.S. stock trading setups.
- MEXC users can also apply the same DDI analysis framework to crypto trading.
1. What Is DDI?
DDI is a trend indicator that compares the proportions of upward and downward stock price movements relative to the previous trading day over a given period. Moving averages are then used to smooth the indicator. Rather than focusing on potential overbought or oversold conditions, DDI emphasizes the balance between upward and downward price movements, helping traders assess whether prices are trending higher or lower.
In the U.S. stock market, individual stocks can experience substantial volatility and pronounced trends. DDI offers a visual way to assess the direction and relative dominance of upward or downward price movements, making it a useful tool for beginners learning to recognize trends.
2. How to Use DDI in U.S. Stock Trading
DDI can help identify potential shifts in the balance between upward and downward price movements. In practice, traders can focus on the following signals and considerations:
2.1 Potential buy signals
1) DDI turns from negative to positive: When DDI crosses above zero, upward directional movement outweighs downward directional movement over the calculation period. This may indicate strengthening upward momentum.
2) DDI crosses above its weighted average (ADDI): When DDI crosses above ADDI to form a golden cross, it may indicate that short-term momentum is shifting upward. Traders may use this as supporting evidence of a potential trend beginning or continuing.
3) Assess the strength of the setup: If both signals occur together while the stock price rises on increasing trading volume, the combination may provide stronger support for a potential buying opportunity.
2.2 Potential sell signals
1) DDI turns from positive to negative: When DDI crosses below zero, downward directional movement outweighs upward directional movement. This may suggest that an existing uptrend is weakening and a downtrend could be developing.
2) DDI crosses below its weighted average (ADDI): When DDI crosses below ADDI to form a death cross, it may indicate weakening upward momentum. Traders holding positions may consider reducing their exposure or exiting to reassess the market.
3) Watch for bearish divergence: If the stock price reaches a new high but DDI does not, bearish divergence forms. This may warn of a potential trend reversal, prompting traders to assess the risk of a pullback.
2.3 Important considerations
1) Watch for market noise in sideways markets: DDI is a momentum-based trend indicator. During consolidation, it may repeatedly cross above and below zero, with frequent crossovers reflecting market noise rather than a sustained trend. Traders may reduce trading frequency and wait for a clearer trend before entering a position.
2) Use other tools for confirmation: Consider combining DDI with changes in trading volume, moving averages, and Bollinger Bands to identify potential support and resistance levels For example, a potential DDI buy signal may carry more weight when the stock price also holds above a key moving average.
3) Adjust parameters to your trading style: Short-term traders may shorten the calculation period to make the indicator more responsive. Medium- to long-term investors may start with the default settings to help filter short-term market noise and focus on more sustained trends.
4) Apply disciplined risk management: Any indicator signal can fail. Before entering a trade, define a stop-loss level and limit the proportion of capital allocated to the position to reduce the risk of a large loss from relying on a single signal.
3. How to Add DDI to U.S. Stock Charts on MEXC
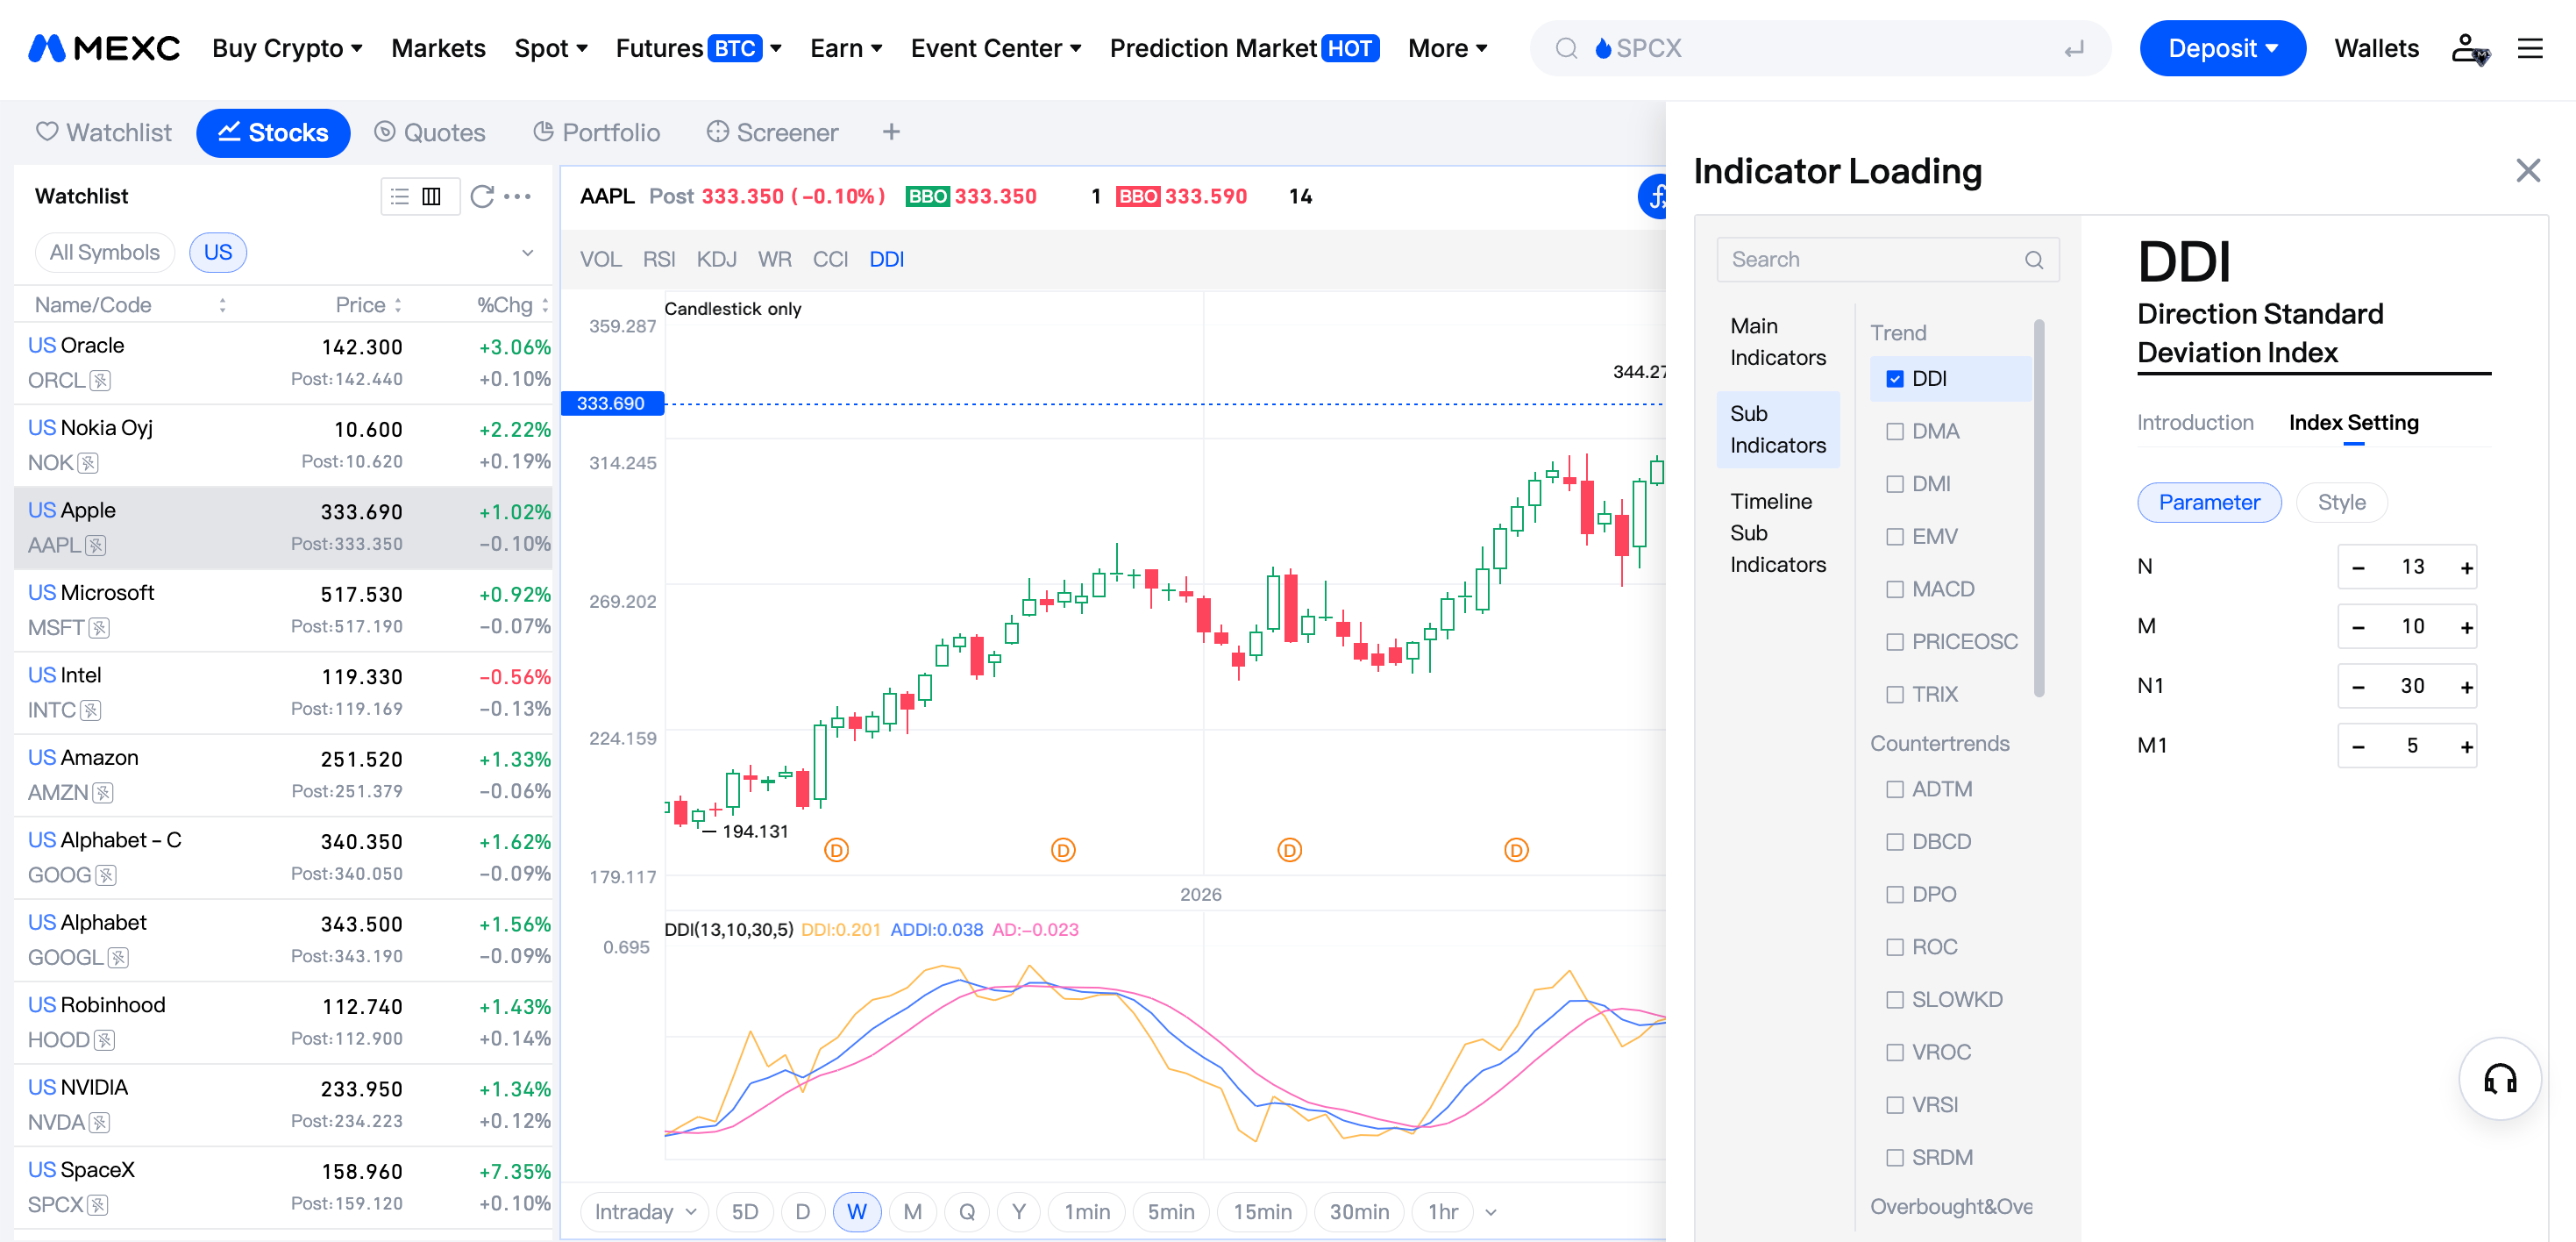
MEXC's U.S. stock trading interface allows you to add and configure DDI. Follow these steps:
1) Log in to your account, go to the U.S. stock trading page, and open the price chart for your chosen stock.
2) Click the indicator button above the chart. In the Indicator Loading panel, search for and select DDI.
3) Once added, adjust the period parameters to suit your trading approach. The indicator lines will appear automatically on the chart. Beginners can start with the default settings on a daily chart, then customize them after becoming familiar with the indicator.
4. DDI FAQ
4.1 What is the DDI indicator
DDI is a trend indicator that compares the proportions of upward and downward stock price movements. Together with its smoothed averages, it helps traders assess trend direction and the balance between upward and downward movement.
4.2 How does DDI differ from standard deviation?
Standard deviation measures how widely values are dispersed around their mean. DDI instead compares upward and downward directional movement using changes in price highs and lows. Despite its name, DDI is not a measure of dispersion around a mean or a standardized deviation score.
4.3 How is DDI calculated?
DDI = (U - D) / (U + D), where U and D are the sums of upward and downward directional movement over the selected period. For each period, the movement magnitude is the larger of the absolute change in the high and the absolute change in the low. It is assigned to upward movement if the sum of the high and low rises from the previous period, or downward movement if that sum falls; both are zero if it is unchanged.
This is equivalent to subtracting the downward movement proportion (DIF) from the upward movement proportion (DIZ): DDI = DIZ - DIF. It is not the formula "(measured value - target mean) / standard deviation." The ratio requires a nonzero total movement.
4.4 Is a DDI reading of 0.5 good? Is 2 high?
Under the unscaled formula above, DDI ranges from -1 to +1 when defined. A reading of 0.5 indicates that upward directional movement outweighs downward movement; it is not inherently "good" or a guaranteed buy signal. A reading of 2 falls outside this range. Interpret DDI in the context of the asset, its recent price action, and the chart's calculation and display conventions, rather than applying standard deviation or quality-control thresholds.