Buy Crypto
Markets
Spot
FuturesBTC
Earn
Event Center
Rewards Hub
More
100%+ PoR
How to Use the Contrarian Operating System (CDP) in Stocks Trading: A Complete Beginner's GuideHow to Use the Contrarian Operating System (CDP) in Stocks Trading: A Complete Beginner's Guide
Category List
Cancel

How to Use the Contrarian Operating System (CDP) in Stocks Trading: A Complete Beginner's Guide

Key Takeaways:

  • The Contrarian Operating System (CDP) is a very short-term technical indicator based on the previous trading day's price data, making it a useful reference for intraday trading.
  • CDP uses five key price levels to identify areas of market strength and weakness, helping traders assess support and resistance.
  • CDP can be used both for contrarian strategies that aim to buy low and sell high and for trend-following entries on breakouts.
  • Given the volatility of stocks, traders using CDP should pay close attention to opening-price signals and maintain the discipline of closing positions within the same trading day.

1. What Is the Contrarian Operating System (CDP)


The Contrarian Operating System (CDP), developed by renowned technical analyst J. Welles Wilder Jr., is a technical analysis tool designed for very short-term trading. It uses the previous trading day's high, low, and closing prices to calculate five key price levels for the current session's potential trading range. These levels divide market conditions into five categories: very strong, strong, consolidating, weak, and very weak, providing reference points for intraday entries and exits.

For stock traders who trade intraday, CDP requires no additional parameter settings. Its simple calculations and straightforward signals make it a commonly used tool for identifying the day's support and resistance areas.

2. How to Calculate CDP


Let H represent the previous trading day's high, L the previous trading day's low, and C the previous trading day's closing price. The calculations are as follows:

  • Central value = (H + L + 2 × C) ÷ 4
  • Highest value = Central value + (H − L)
  • Near-high value = Central value × 2 − L
  • Near-low value = Central value × 2 − H
  • Lowest value = Central value − (H − L)

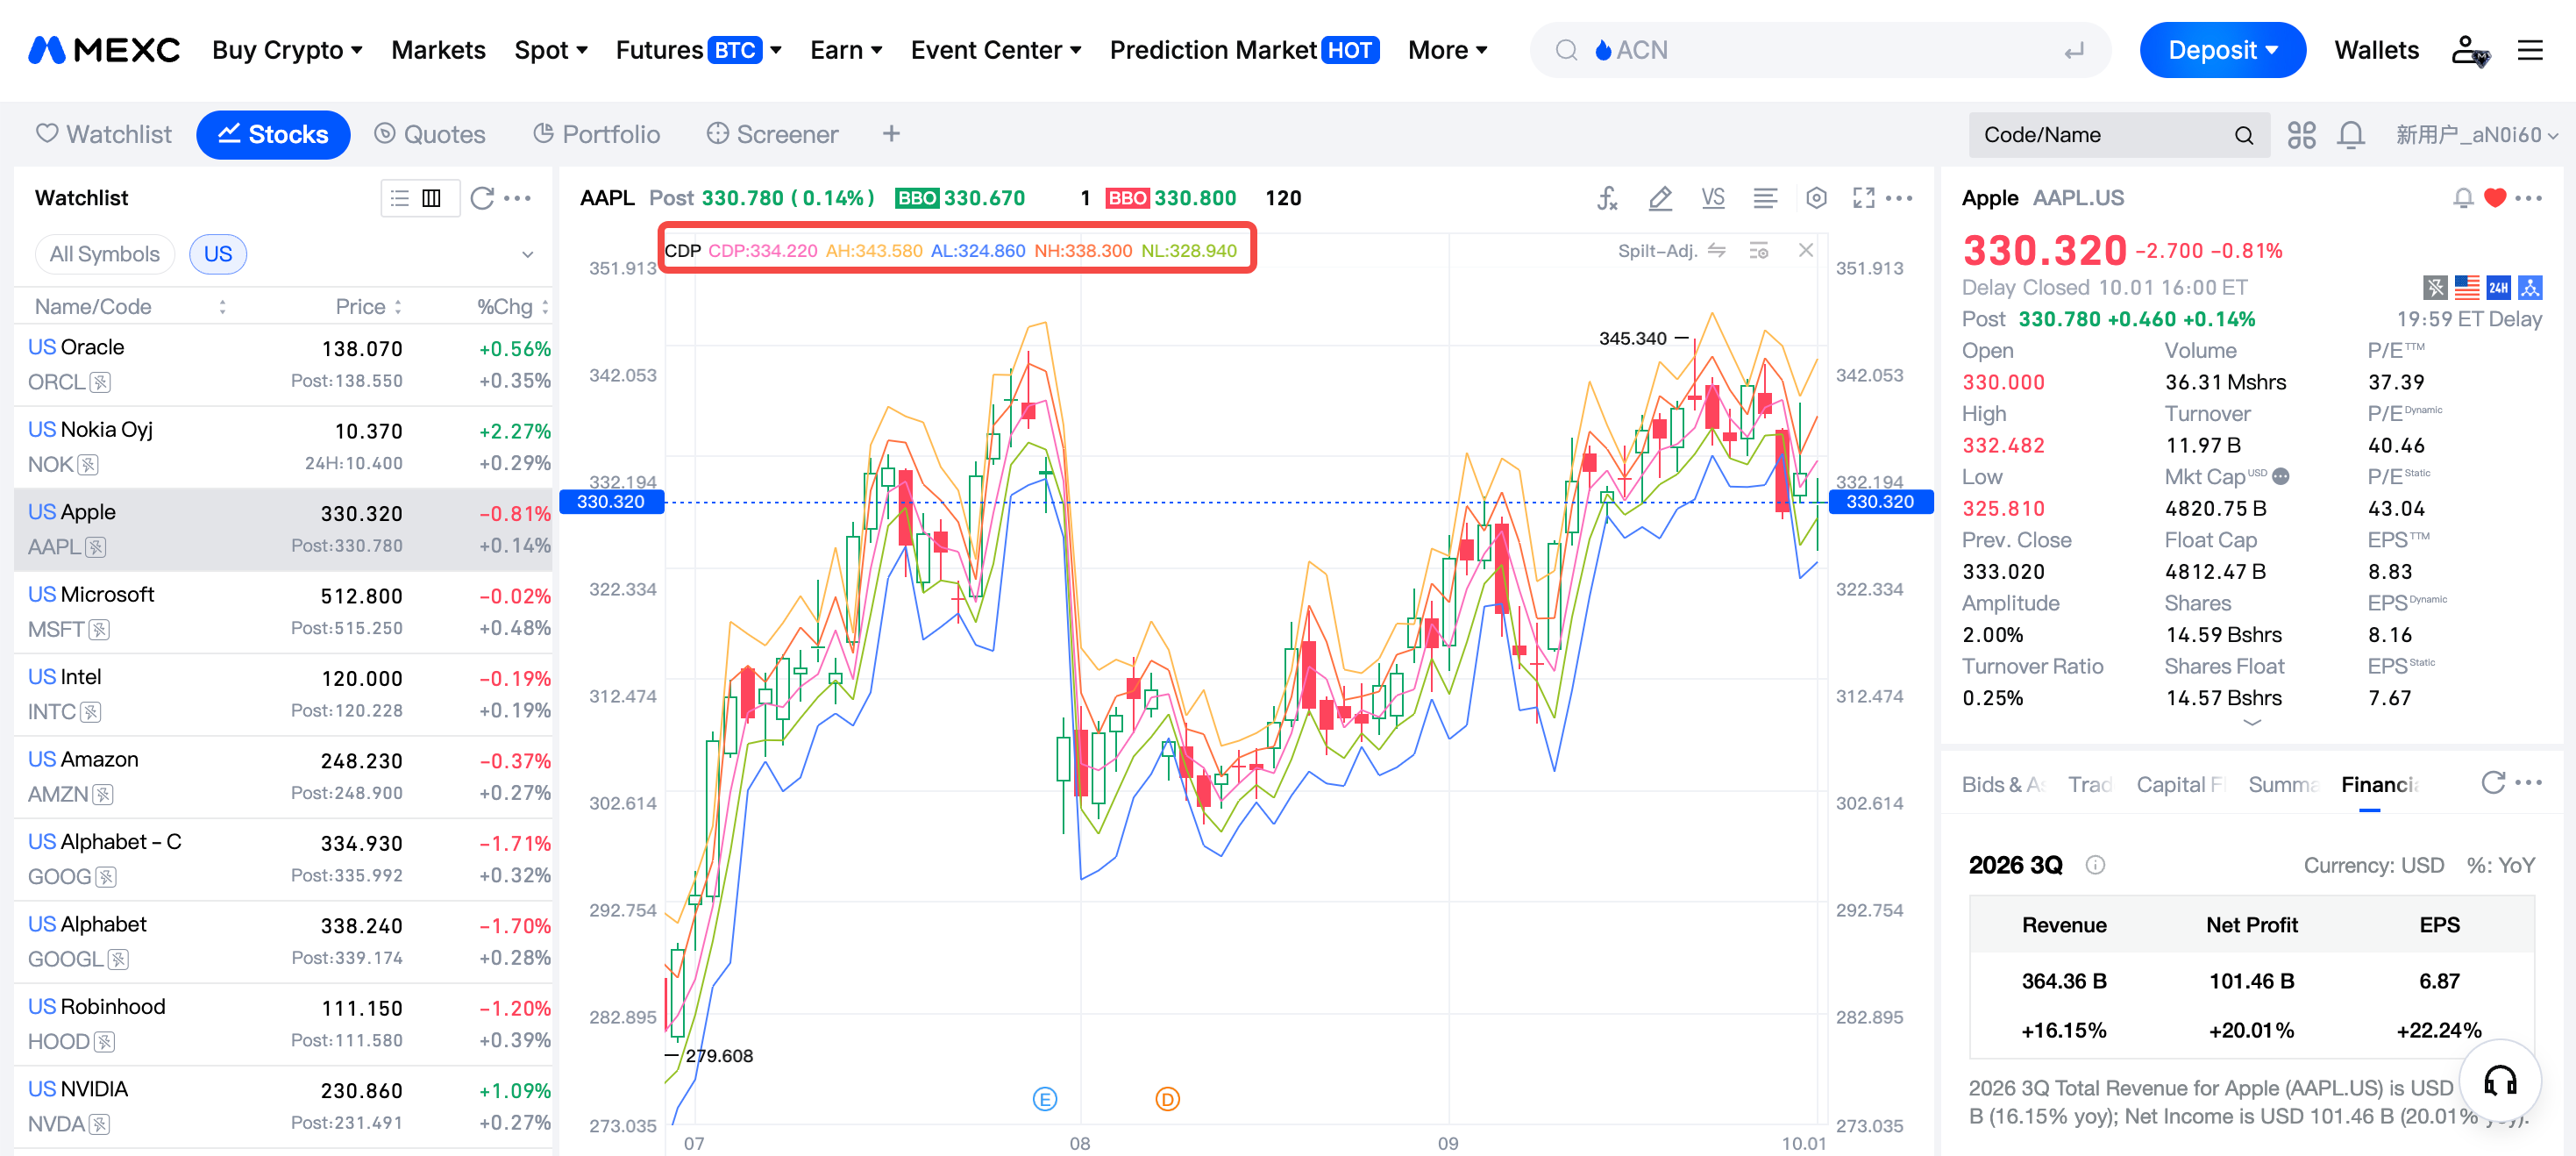
The five price levels follow a fixed order from highest to lowest: Highest value > Near-high value > Central value > Near-low value > Lowest value. These five lines divide the day's price action into five zones, with the position of price indicating the relative strength of buyers and sellers during the session.

3. The Five Key CDP Price Levels


Highest value (boundary of the very strong zone): A break above this level indicates exceptional market strength and is often associated with a gap-up opening or the start of a major price move.

Near-high value (upper boundary of the strong zone): In a consolidating market, this level is generally viewed as short-term resistance and a reference point for selling.

Central value (dividing line between bullish and bearish conditions): An opening or current price above this level suggests a bullish bias, while a price below it suggests a bearish bias.

Near-low value (lower boundary of the weak zone): In a consolidating market, a pullback toward this level is generally viewed as a test of short-term support and a potential reference point for buying.

Lowest value (boundary of the very weak zone): A break below this level indicates exceptional market weakness and may mark the start of a bearish move.

4. CDP Strategies: How to Apply Them in Intraday Stocks Trading


4.1 Contrarian trading in consolidating markets


When stocks open between the near-high and near-low values, this typically suggests a limited intraday trading range that may suit a contrarian, range-trading approach. Traders may consider a short-term buy when price crosses upward through the area around the lowest value, or a short-term sell when price crosses downward through the area around the highest value.

4.2 Trend-following trading on breakouts


A break above the highest or near-high value indicates strong buying pressure and may provide an opportunity to enter a long position in the direction of the move. A break below the near-low or lowest value suggests that sellers are in control, and traders may consider going short or exiting a position to limit losses.

4.3 Pay attention to opening-price signals


The opening price is a key reference when using CDP in Stocks trading. An opening near the highest value indicates a gap up and very strong market conditions, which may prompt traders to consider buying into the move. An opening near the lowest value indicates a gap down and very weak conditions, which may call for selling into the decline or staying out of the market. If the opening signal is missed, the indicator's usefulness gradually diminishes as buyers and sellers repeatedly compete during the session.

4.4 Maintain strict intraday discipline


CDP is a very short-term trading tool. When using it, set stop-loss orders and close positions before the end of the trading day to avoid turning a short-term trade into overnight risk.

5. How to Add CDP to Stocks Charts on MEXC


The Stocks trading feature on MEXC supports adding and configuring the Contrarian Operating System. Follow these simple steps:

1) Log in to your account, go to the Stocks trading page, and open the price chart for your chosen stock.

2) Click the indicator button above the chart, then search for and select CDP in the indicator list.

3) Once the indicator is added, you can adjust its period parameters to suit your trading preferences, and the system will automatically plot the lines on the chart. Beginners are advised to start with the default parameters and observe the indicator on a daily chart before making personalized adjustments after becoming familiar with how it works.


6. CDP FAQ


6.1 What is a contrarian indicator?


A contrarian indicator is a technical tool that highlights potential opportunities to trade against prevailing sentiment when market emotions reach extremes. CDP is a typical example: it uses the previous day's price data to establish support and resistance areas, helping identify potential short-term opportunities to buy low and sell high.

6.2 What does a contrarian bullish signal mean?


It is a buy signal that appears when sentiment is broadly pessimistic and price has fallen to key support, such as the area around CDP's lowest value. It suggests that selling pressure may be nearing exhaustion and that a rebound may be possible.

6.3 What is a contrarian trading strategy?


A contrarian strategy trades against prevailing market sentiment. It involves buying when price has fallen excessively into a support area and selling when price has risen excessively into a resistance area, with the aim of profiting as price reverts toward its mean.

6.4 Who is CDP suitable for?


CDP is primarily suited to intraday and very short-term traders. Medium- and long-term investors may use it as a supplementary reference for timing entries and exits, but should not rely on it alone.

6.5 Are there risks when using CDP?


Yes. False breakouts can occur, and the indicator becomes less useful after the opening signal has been missed. It should therefore not be used on its own. Maintain stop-loss discipline and combine it with other indicators when assessing the market.

How to Use the Contrarian Operating System (CDP) in Stocks Trading: A Complete Beginner's Guide

Key Takeaways:

  • The Contrarian Operating System (CDP) is a very short-term technical indicator based on the previous trading day's price data, making it a useful reference for intraday trading.
  • CDP uses five key price levels to identify areas of market strength and weakness, helping traders assess support and resistance.
  • CDP can be used both for contrarian strategies that aim to buy low and sell high and for trend-following entries on breakouts.
  • Given the volatility of stocks, traders using CDP should pay close attention to opening-price signals and maintain the discipline of closing positions within the same trading day.

1. What Is the Contrarian Operating System (CDP)


The Contrarian Operating System (CDP), developed by renowned technical analyst J. Welles Wilder Jr., is a technical analysis tool designed for very short-term trading. It uses the previous trading day's high, low, and closing prices to calculate five key price levels for the current session's potential trading range. These levels divide market conditions into five categories: very strong, strong, consolidating, weak, and very weak, providing reference points for intraday entries and exits.

For stock traders who trade intraday, CDP requires no additional parameter settings. Its simple calculations and straightforward signals make it a commonly used tool for identifying the day's support and resistance areas.

2. How to Calculate CDP


Let H represent the previous trading day's high, L the previous trading day's low, and C the previous trading day's closing price. The calculations are as follows:

  • Central value = (H + L + 2 × C) ÷ 4
  • Highest value = Central value + (H − L)
  • Near-high value = Central value × 2 − L
  • Near-low value = Central value × 2 − H
  • Lowest value = Central value − (H − L)

The five price levels follow a fixed order from highest to lowest: Highest value > Near-high value > Central value > Near-low value > Lowest value. These five lines divide the day's price action into five zones, with the position of price indicating the relative strength of buyers and sellers during the session.


3. The Five Key CDP Price Levels


Highest value (boundary of the very strong zone): A break above this level indicates exceptional market strength and is often associated with a gap-up opening or the start of a major price move.

Near-high value (upper boundary of the strong zone): In a consolidating market, this level is generally viewed as short-term resistance and a reference point for selling.

Central value (dividing line between bullish and bearish conditions): An opening or current price above this level suggests a bullish bias, while a price below it suggests a bearish bias.

Near-low value (lower boundary of the weak zone): In a consolidating market, a pullback toward this level is generally viewed as a test of short-term support and a potential reference point for buying.

Lowest value (boundary of the very weak zone): A break below this level indicates exceptional market weakness and may mark the start of a bearish move.

4. CDP Strategies: How to Apply Them in Intraday Stocks Trading


4.1 Contrarian trading in consolidating markets


When stocks open between the near-high and near-low values, this typically suggests a limited intraday trading range that may suit a contrarian, range-trading approach. Traders may consider a short-term buy when price crosses upward through the area around the lowest value, or a short-term sell when price crosses downward through the area around the highest value.

4.2 Trend-following trading on breakouts


A break above the highest or near-high value indicates strong buying pressure and may provide an opportunity to enter a long position in the direction of the move. A break below the near-low or lowest value suggests that sellers are in control, and traders may consider going short or exiting a position to limit losses.

4.3 Pay attention to opening-price signals


The opening price is a key reference when using CDP in Stocks trading. An opening near the highest value indicates a gap up and very strong market conditions, which may prompt traders to consider buying into the move. An opening near the lowest value indicates a gap down and very weak conditions, which may call for selling into the decline or staying out of the market. If the opening signal is missed, the indicator's usefulness gradually diminishes as buyers and sellers repeatedly compete during the session.

4.4 Maintain strict intraday discipline


CDP is a very short-term trading tool. When using it, set stop-loss orders and close positions before the end of the trading day to avoid turning a short-term trade into overnight risk.

5. How to Add CDP to Stocks Charts on MEXC


The Stocks trading feature on MEXC supports adding and configuring the Contrarian Operating System. Follow these simple steps:

1) Log in to your account, go to the Stocks trading page, and open the price chart for your chosen stock.

2) Click the indicator button above the chart, then search for and select CDP in the indicator list.

3) Once the indicator is added, you can adjust its period parameters to suit your trading preferences, and the system will automatically plot the lines on the chart. Beginners are advised to start with the default parameters and observe the indicator on a daily chart before making personalized adjustments after becoming familiar with how it works.


6. CDP FAQ


6.1 What is a contrarian indicator?


A contrarian indicator is a technical tool that highlights potential opportunities to trade against prevailing sentiment when market emotions reach extremes. CDP is a typical example: it uses the previous day's price data to establish support and resistance areas, helping identify potential short-term opportunities to buy low and sell high.

6.2 What does a contrarian bullish signal mean?


It is a buy signal that appears when sentiment is broadly pessimistic and price has fallen to key support, such as the area around CDP's lowest value. It suggests that selling pressure may be nearing exhaustion and that a rebound may be possible.

6.3 What is a contrarian trading strategy?


A contrarian strategy trades against prevailing market sentiment. It involves buying when price has fallen excessively into a support area and selling when price has risen excessively into a resistance area, with the aim of profiting as price reverts toward its mean.

6.4 Who is CDP suitable for?


CDP is primarily suited to intraday and very short-term traders. Medium- and long-term investors may use it as a supplementary reference for timing entries and exits, but should not rely on it alone.

6.5 Are there risks when using CDP?


Yes. False breakouts can occur, and the indicator becomes less useful after the opening signal has been missed. It should therefore not be used on its own. Maintain stop-loss discipline and combine it with other indicators when assessing the market.