Buy Crypto
Markets
Spot
FuturesBTC
Earn
Event Center
Rewards Hub
More
How to Use the Exponential Moving Average Indicator in Trading: A Complete Beginner's GuideHow to Use the Exponential Moving Average Indicator in Trading: A Complete Beginner's Guide
Category List
Cancel

How to Use the Exponential Moving Average Indicator in Trading: A Complete Beginner's Guide

Key Takeaways

  • The exponential moving average is a trend-following technical indicator that assigns greater weight to recent prices, allowing it to respond more quickly to recent market changes.
  • By smoothing price fluctuations, the exponential moving average helps traders identify trend direction and potential buying or selling opportunities.
  • The main difference between the exponential moving average and the simple moving average lies in how price data is weighted. The exponential moving average is more sensitive to recent price changes.
  • Common uses include identifying trends, finding dynamic support and resistance, and monitoring golden cross and death cross signals.
  • Users can add the exponential moving average indicator to candlestick charts on MEXC and combine it with other tools to develop trading strategies.

1. What Is an Exponential Moving Average?


The exponential moving average (EMA) is one of the most commonly used technical analysis indicators in both cryptocurrency and traditional financial markets. It helps identify market trends by calculating the weighted average price over a specified period. Its main characteristic is that more recent price data receives greater weight, while the influence of older data decreases exponentially.

This design is based on the assumption that recent prices reflect current market sentiment and supply and demand conditions more accurately than older prices. Compared with a simple moving average (SMA), the EMA can capture recent price movements more quickly, making it particularly suitable for highly volatile and fast-moving cryptocurrency markets.

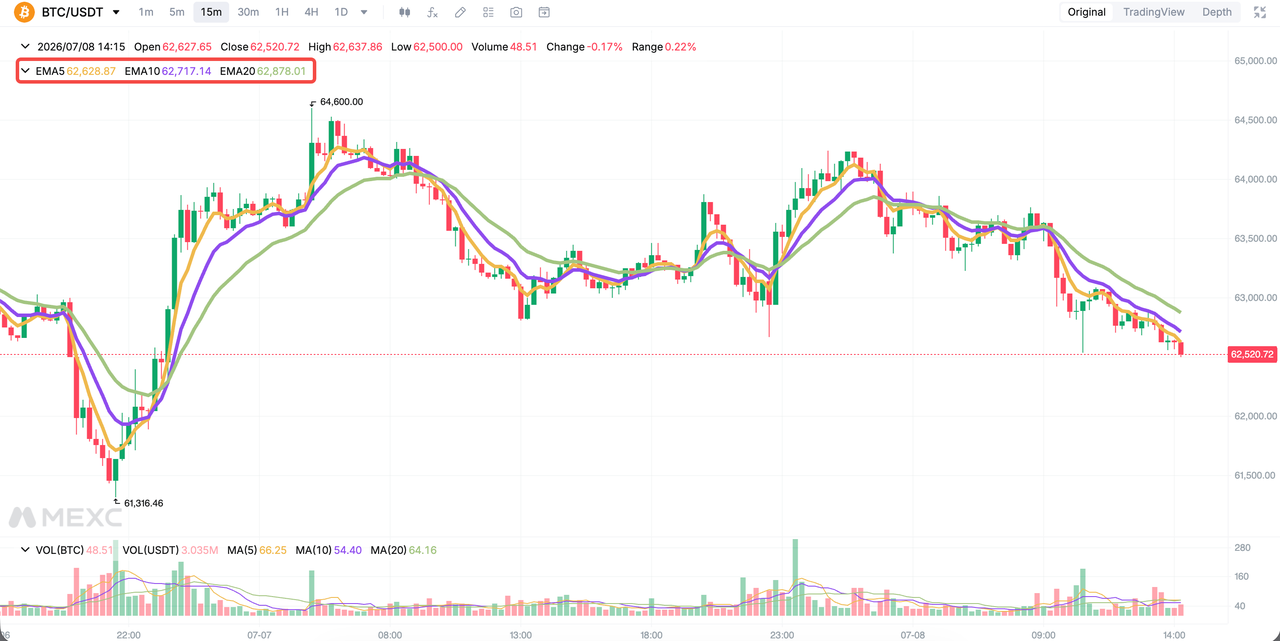
On MEXC market charts, users can add EMAs with different periods to any trading pair, such as the 20-day, 50-day, 100-day, or 200-day EMA, to observe short-term momentum and long-term trends.

2. Exponential Moving Average Formula


The exponential moving average is calculated in three steps:

Step 1: Calculate the initial value
First, calculate the simple moving average for the selected period as the starting value. For example, for a 20-day period, add the closing prices from the previous 20 days and divide the total by 20.

Step 2: Calculate the smoothing factor
Smoothing factor = 2 / (Number of periods + 1)

For a 20-day period, the smoothing factor is approximately 0.095.

Step 3: Calculate the current EMA
Current EMA = (Current closing price - Previous EMA) × Smoothing factor + Previous EMA

As shown in the formula, the EMA uses recursive calculation. Each new value is based on the previous day's EMA, preserving historical trend information while giving greater influence to the latest price.

The shorter the period, the larger the smoothing factor and the faster the EMA responds to price changes.

3. Differences Between EMA and SMA


A simple moving average assigns equal weight to every price within the selected period, while an exponential moving average gives greater weight to more recent prices.

The main differences are as follows:
  • Sensitivity: The EMA reacts more quickly to recent price changes and has less lag, while the SMA responds more slowly and produces a smoother curve.
  • Suitable market conditions: The EMA is more suitable for short-term trading and highly volatile markets, while the SMA is more suitable for observing long-term and relatively stable trends.
  • Signal quality: EMA signals appear earlier but are also more likely to produce false signals. SMA signals appear later but are generally more stable.

Neither indicator is universally better. In actual trading, many traders monitor both the EMA and SMA to gain a more comprehensive view of the market.

4. How to Use the Exponential Moving Average Indicator in Trading


4.1 Identify the trend direction


This is the most basic use of the EMA.

When the price is above the EMA and the EMA is sloping upward, the market is generally considered to be in an uptrend, and traders may look for buying opportunities.

When the price is below the EMA and the EMA is sloping downward, the market is generally considered to be in a downtrend. Traders should be cautious about buying at higher prices or may consider exiting their positions.

4.2 Use the EMA as dynamic support and resistance


During an uptrend, a rising EMA often acts as a dynamic price floor. When the price pulls back toward the EMA, it may find support, providing a common reference point for potential buying opportunity.

During a downtrend, a declining EMA may act as a dynamic ceiling. When the price rebounds toward the EMA, it may encounter resistance.

4.3 Dual EMA crossover strategy: Golden cross and death cross


Combining two EMAs with different periods is a classic trading strategy:
  • Golden cross: A short-term EMA, such as the 20-day EMA, crosses above a longer-term EMA, such as the 50-day or 200-day EMA. This is considered a bullish signal and may indicate the beginning of an uptrend.
  • Death cross: A short-term EMA crosses below a longer-term EMA. This is considered a bearish signal and may indicate the beginning of a downtrend.

The crossover between the 50-day and 200-day EMAs is commonly used as an important reference for identifying medium- to long-term shifts between bullish and bearish market conditions.

5. How to Set Up the Exponential Moving Average on MEXC


Navigation: MEXC official website → Spot/Futures → Indicators → EMA

Users can display multiple EMAs with different periods at the same time and combine them with other tools, such as the Relative Strength Index and Bollinger Bands, for more comprehensive analysis.

Beginners are advised to start with small amounts and gradually become familiar with how the indicator performs under real market conditions.


6. Limitations of the Exponential Moving Average


Although the EMA is highly practical, it also has several limitations:
  • Based on historical data: The EMA only reflects price movements that have already occurred and cannot predict future prices.
  • Recency bias: Because it places greater emphasis on recent data, it may produce misleading signals when the market is extremely overbought or oversold.
  • False signals: In sideways markets, frequent price movements above and below the EMA may create false trading signals.

The EMA should therefore be used together with other technical indicators, fundamental analysis, and strict risk management. Traders should not rely on any single indicator when making trading decisions.

7. Exponential Moving Average FAQ


7.1 How do I use an exponential moving average?


Observe the relationship between the price and the EMA to identify the trend.

When the price is above the EMA and the EMA is rising, the market is generally in a bullish trend. When the price is below the EMA and the EMA is declining, the market is generally in a bearish trend.

The EMA can also be used as dynamic support or resistance to help determine potential entry and exit points.

7.2 How do I use the 50-day and 200-day EMAs?


The 50-day EMA represents the medium-term trend, while the 200-day EMA represents the long-term trend.

When the 50-day EMA crosses above the 200-day EMA, it forms a golden cross and is considered a bullish signal. When it crosses below the 200-day EMA, it forms a death cross and is considered a bearish signal.

These crossovers are commonly used to identify changes between bullish and bearish market conditions.

7.3 How is the exponential moving average calculated?


Current EMA = (Current closing price - Previous EMA) × Smoothing factor + Previous EMA

Smoothing factor = 2 / (Number of periods + 1)

7.4 What is the difference between an EMA and an SMA?


An EMA assigns greater weight to recent prices, responds more quickly, and has less lag.

An SMA gives equal weight to all prices within the selected period, producing a smoother curve but responding more slowly to price changes.

7.5 What is the 9-day EMA in trading?


The 9-day EMA is a fast-moving average commonly used by short-term traders to capture short-term price momentum.

It is often combined with the 20-day or 21-day EMA to identify crossover signals.

7.6 How do professional traders use the EMA?


Professional traders usually combine multiple EMAs with different periods and use them together with trading volume, momentum indicators, and support and resistance analysis.

They may also backtest their strategies using historical data and apply strict stop-loss settings to control risk.

The exponential moving average is a practical trend indicator that balances responsiveness and stability. Whether it is used to identify market direction, locate support and resistance, or build golden cross and death cross strategies, it can provide valuable references for trading decisions.


Risk Warning: Technical indicators are based on historical data and do not guarantee future performance. Digital assets are highly volatile. Trade cautiously based on your risk tolerance and avoid blindly following market trends.

How to Use the Exponential Moving Average Indicator in Trading: A Complete Beginner's Guide

Key Takeaways

  • The exponential moving average is a trend-following technical indicator that assigns greater weight to recent prices, allowing it to respond more quickly to recent market changes.
  • By smoothing price fluctuations, the exponential moving average helps traders identify trend direction and potential buying or selling opportunities.
  • The main difference between the exponential moving average and the simple moving average lies in how price data is weighted. The exponential moving average is more sensitive to recent price changes.
  • Common uses include identifying trends, finding dynamic support and resistance, and monitoring golden cross and death cross signals.
  • Users can add the exponential moving average indicator to candlestick charts on MEXC and combine it with other tools to develop trading strategies.

1. What Is an Exponential Moving Average?


The exponential moving average (EMA) is one of the most commonly used technical analysis indicators in both cryptocurrency and traditional financial markets. It helps identify market trends by calculating the weighted average price over a specified period. Its main characteristic is that more recent price data receives greater weight, while the influence of older data decreases exponentially.

This design is based on the assumption that recent prices reflect current market sentiment and supply and demand conditions more accurately than older prices. Compared with a simple moving average (SMA), the EMA can capture recent price movements more quickly, making it particularly suitable for highly volatile and fast-moving cryptocurrency markets.

On MEXC market charts, users can add EMAs with different periods to any trading pair, such as the 20-day, 50-day, 100-day, or 200-day EMA, to observe short-term momentum and long-term trends.


2. Exponential Moving Average Formula


The exponential moving average is calculated in three steps:

Step 1: Calculate the initial value
First, calculate the simple moving average for the selected period as the starting value. For example, for a 20-day period, add the closing prices from the previous 20 days and divide the total by 20.

Step 2: Calculate the smoothing factor
Smoothing factor = 2 / (Number of periods + 1)

For a 20-day period, the smoothing factor is approximately 0.095.

Step 3: Calculate the current EMA
Current EMA = (Current closing price - Previous EMA) × Smoothing factor + Previous EMA

As shown in the formula, the EMA uses recursive calculation. Each new value is based on the previous day's EMA, preserving historical trend information while giving greater influence to the latest price.

The shorter the period, the larger the smoothing factor and the faster the EMA responds to price changes.

3. Differences Between EMA and SMA


A simple moving average assigns equal weight to every price within the selected period, while an exponential moving average gives greater weight to more recent prices.

The main differences are as follows:
  • Sensitivity: The EMA reacts more quickly to recent price changes and has less lag, while the SMA responds more slowly and produces a smoother curve.
  • Suitable market conditions: The EMA is more suitable for short-term trading and highly volatile markets, while the SMA is more suitable for observing long-term and relatively stable trends.
  • Signal quality: EMA signals appear earlier but are also more likely to produce false signals. SMA signals appear later but are generally more stable.

Neither indicator is universally better. In actual trading, many traders monitor both the EMA and SMA to gain a more comprehensive view of the market.

4. How to Use the Exponential Moving Average Indicator in Trading


4.1 Identify the trend direction


This is the most basic use of the EMA.

When the price is above the EMA and the EMA is sloping upward, the market is generally considered to be in an uptrend, and traders may look for buying opportunities.

When the price is below the EMA and the EMA is sloping downward, the market is generally considered to be in a downtrend. Traders should be cautious about buying at higher prices or may consider exiting their positions.

4.2 Use the EMA as dynamic support and resistance


During an uptrend, a rising EMA often acts as a dynamic price floor. When the price pulls back toward the EMA, it may find support, providing a common reference point for potential buying opportunity.

During a downtrend, a declining EMA may act as a dynamic ceiling. When the price rebounds toward the EMA, it may encounter resistance.

4.3 Dual EMA crossover strategy: Golden cross and death cross


Combining two EMAs with different periods is a classic trading strategy:
  • Golden cross: A short-term EMA, such as the 20-day EMA, crosses above a longer-term EMA, such as the 50-day or 200-day EMA. This is considered a bullish signal and may indicate the beginning of an uptrend.
  • Death cross: A short-term EMA crosses below a longer-term EMA. This is considered a bearish signal and may indicate the beginning of a downtrend.

The crossover between the 50-day and 200-day EMAs is commonly used as an important reference for identifying medium- to long-term shifts between bullish and bearish market conditions.

5. How to Set Up the Exponential Moving Average on MEXC


Navigation: MEXC official website → Spot/Futures → Indicators → EMA

Users can display multiple EMAs with different periods at the same time and combine them with other tools, such as the Relative Strength Index and Bollinger Bands, for more comprehensive analysis.

Beginners are advised to start with small amounts and gradually become familiar with how the indicator performs under real market conditions.


6. Limitations of the Exponential Moving Average


Although the EMA is highly practical, it also has several limitations:
  • Based on historical data: The EMA only reflects price movements that have already occurred and cannot predict future prices.
  • Recency bias: Because it places greater emphasis on recent data, it may produce misleading signals when the market is extremely overbought or oversold.
  • False signals: In sideways markets, frequent price movements above and below the EMA may create false trading signals.

The EMA should therefore be used together with other technical indicators, fundamental analysis, and strict risk management. Traders should not rely on any single indicator when making trading decisions.

7. Exponential Moving Average FAQ


7.1 How do I use an exponential moving average?


Observe the relationship between the price and the EMA to identify the trend.

When the price is above the EMA and the EMA is rising, the market is generally in a bullish trend. When the price is below the EMA and the EMA is declining, the market is generally in a bearish trend.

The EMA can also be used as dynamic support or resistance to help determine potential entry and exit points.

7.2 How do I use the 50-day and 200-day EMAs?


The 50-day EMA represents the medium-term trend, while the 200-day EMA represents the long-term trend.

When the 50-day EMA crosses above the 200-day EMA, it forms a golden cross and is considered a bullish signal. When it crosses below the 200-day EMA, it forms a death cross and is considered a bearish signal.

These crossovers are commonly used to identify changes between bullish and bearish market conditions.

7.3 How is the exponential moving average calculated?


Current EMA = (Current closing price - Previous EMA) × Smoothing factor + Previous EMA

Smoothing factor = 2 / (Number of periods + 1)

7.4 What is the difference between an EMA and an SMA?


An EMA assigns greater weight to recent prices, responds more quickly, and has less lag.

An SMA gives equal weight to all prices within the selected period, producing a smoother curve but responding more slowly to price changes.

7.5 What is the 9-day EMA in trading?


The 9-day EMA is a fast-moving average commonly used by short-term traders to capture short-term price momentum.

It is often combined with the 20-day or 21-day EMA to identify crossover signals.

7.6 How do professional traders use the EMA?


Professional traders usually combine multiple EMAs with different periods and use them together with trading volume, momentum indicators, and support and resistance analysis.

They may also backtest their strategies using historical data and apply strict stop-loss settings to control risk.

The exponential moving average is a practical trend indicator that balances responsiveness and stability. Whether it is used to identify market direction, locate support and resistance, or build golden cross and death cross strategies, it can provide valuable references for trading decisions.


Risk Warning: Technical indicators are based on historical data and do not guarantee future performance. Digital assets are highly volatile. Trade cautiously based on your risk tolerance and avoid blindly following market trends.