

How to Use the Price Oscillator (PRICEOSC) in U.S. Stock Trading: A Complete Beginner's Guide
Key Takeaways:
- The Price Oscillator is a moving average-based momentum indicator that measures the difference between two moving averages with different periods.
- It expresses the difference between a short-term and a long-term moving average as a percentage, making it easier to compare assets.
- Its two main applications are identifying market trend direction and buy and sell signals.
- Zero-line crossovers, divergences, and threshold-based assessments are the three most commonly used methods for identifying signals.
- When trading on MEXC, users can combine the Price Oscillator with tools such as the Relative Strength Index to improve the accuracy of their decisions.
1. What Is the Price Oscillator?
The Price Oscillator (PRICEOSC), also known as the Percentage Price Oscillator (PPO), is a moving average-based momentum indicator that measures the difference between two moving averages with different periods. Technical analyst Gerald Appel laid the theoretical foundation for this type of indicator in the late 1970s. He also created the well-known Moving Average Convergence Divergence (MACD) indicator.
The Price Oscillator compares the short-term and long-term moving averages of closing prices, with the difference fluctuating around zero. When the short-term moving average is above the long-term moving average, the indicator is positive, reflecting upward momentum. When the short-term moving average is below the long-term moving average, the indicator is negative, reflecting downward momentum.
The Price Oscillator is widely used in stock, forex, and crypto markets. Users can also add this type of oscillator to U.S. stock charts on MEXC to help assess price trends and identify entry and exit opportunities.
2. How to Calculate the Price Oscillator
The Price Oscillator calculation involves three steps. First, subtract the long-term moving average of closing prices from the short-term moving average. Next, divide the difference by the short-term moving average of closing prices. Finally, multiply the result by 100. The formula is:
Price Oscillator = (Short-term moving average − Long-term moving average) / Short-term moving average × 100
Note that the classic Percentage Price Oscillator (PPO) uses the long-term moving average as the denominator:
PPO = (12-day exponential moving average − 26-day exponential moving average) / 26-day exponential moving average × 100
Although the denominators differ, both calculations follow the same underlying principle: expressing the difference between moving averages as a relative percentage so that the indicator's value is not affected by the asset's price level. In practice, the default periods are typically 12 and 26, with a 9-day exponential moving average used as the signal line. Short-term traders can shorten the periods to increase sensitivity, while swing traders can use longer periods to filter market noise.
3. Two Main Uses of the Price Oscillator
3.1 Identifying market trends
When the short-term moving average is above the long-term moving average and the Price Oscillator is positive, the market is likely in an uptrend. When the short-term moving average is below the long-term moving average and the indicator is negative, the market is likely in a downtrend. The farther the reading is from zero, the stronger the momentum of the current trend.
3.2 Identifying trading signals
A move above zero may be a buy signal, while a move below zero may be a sell signal. Traders can also set specific thresholds. When the Price Oscillator reaches these levels, the market may be in overbought or oversold conditions, helping traders identify potential entry or exit opportunities.
4. How the Price Oscillator Differs From MACD
The MACD indicator measures the absolute difference between two moving averages. Its magnitude is affected by the asset's price level: higher-priced assets naturally tend to have larger MACD readings, while lower-priced assets tend to have smaller readings. As a result, MACD values cannot be directly compared across different assets.
The Price Oscillator converts this difference into a percentage, removing the constraint of differing price levels and allowing traders to compare momentum and volatility across assets in different price ranges. This is particularly useful for MEXC users who monitor multiple trading pairs.
5. How to Add the Price Oscillator to U.S. Stock Charts on MEXC
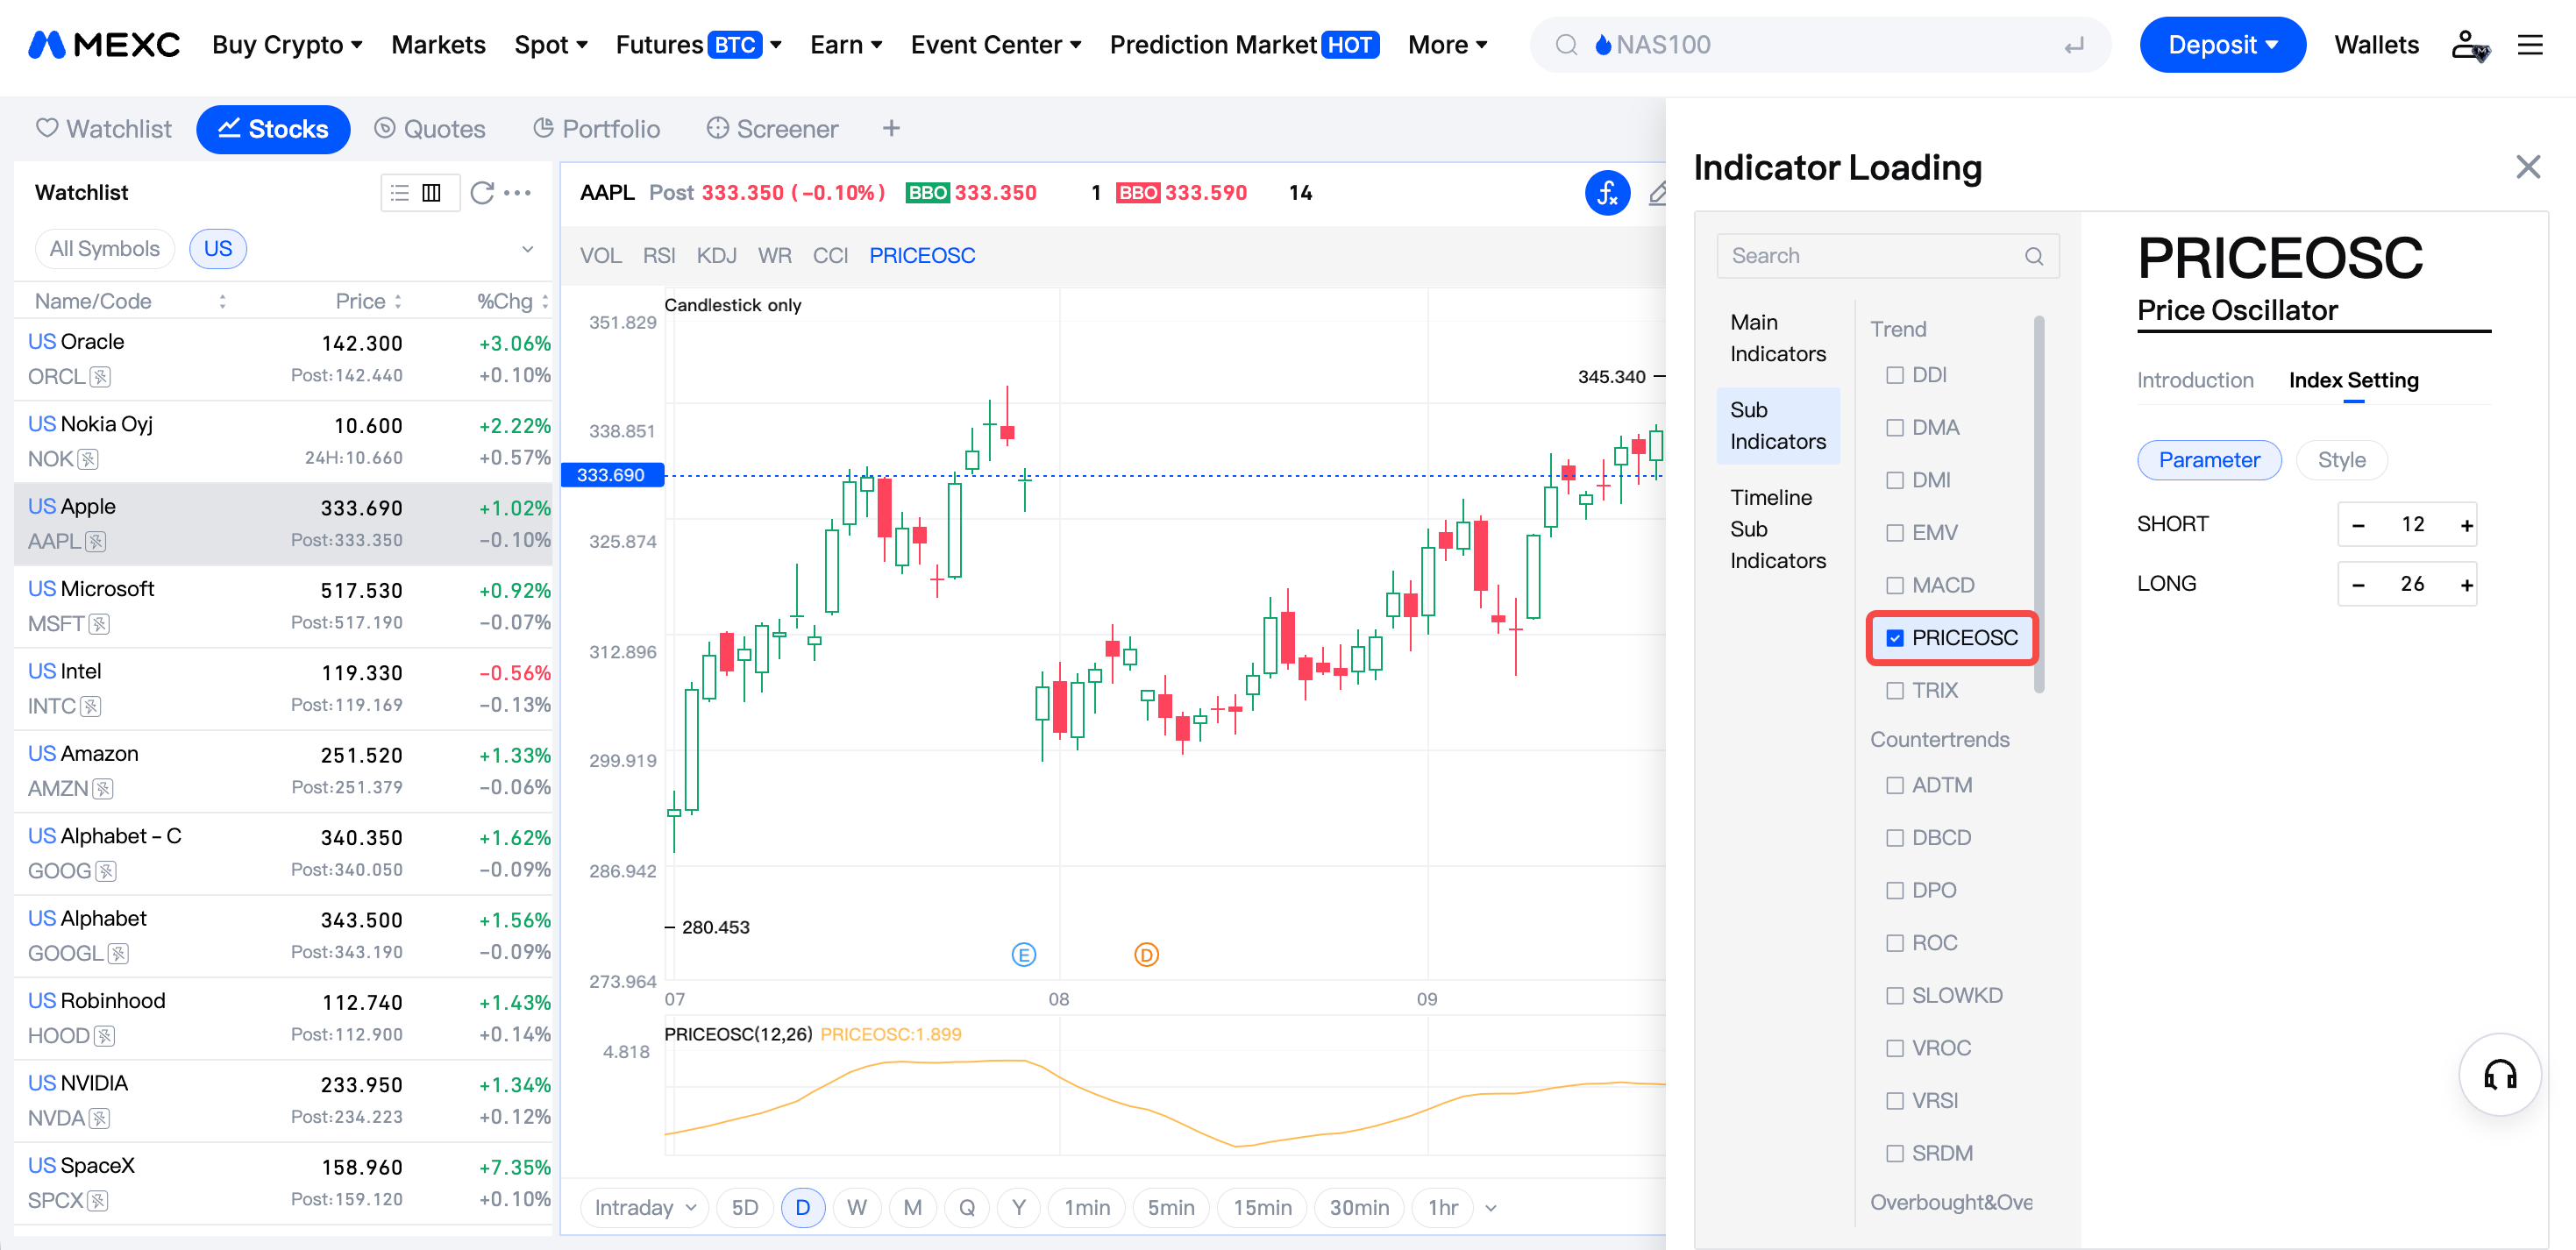
MEXC's U.S. stock trading interface allows users to add and configure the Price Oscillator. Follow these simple steps:
1) Log in to your account, go to the U.S. stock trading page, and open the price chart for your chosen stock.
2) Click the indicator button above the chart, then search for and select PRICEOSC in the indicator list.
3) Once added, adjust the period parameters to suit your trading preferences. The system will automatically plot the indicator on the chart. Beginners are advised to start with the default settings on a daily chart and customize them after becoming familiar with the indicator.
6. Price Oscillator Trading Strategies and Risk Management Tips
1) Confirm the trend direction. Use a longer-term moving average to assess the broader trend. Trading in the direction of the trend can improve the win rate.
2) Wait for signal confirmation. After a zero-line crossover, use trading volume or the Relative Strength Index for additional confirmation. For example, a buy signal that occurs when the Relative Strength Index is in oversold territory is more reliable.
3) Watch for divergence. If the price reaches a new high but the indicator does not, upward momentum is weakening and the market may reverse. The opposite also applies.
4) Set stop-loss levels consistently. For long positions, a stop-loss can be placed below the recent swing low. For short positions, it can be placed above the recent swing high to limit the loss on each trade.
7. Limitations of the Price Oscillator
The Price Oscillator is not an all-purpose tool:
1) Because it is calculated from moving averages, it inherently lags price movements.
2) In sideways markets, the Price Oscillator may repeatedly cross the zero line, producing frequent signals driven by market noise.
3) The Price Oscillator theoretically has no upper limit, making it less effective as a standalone tool for identifying overbought or oversold conditions than the Relative Strength Index or the Stochastic Oscillator.
When trading on MEXC, users are advised to combine it with tools such as trendlines and support and resistance levels, while maintaining disciplined position sizing.
8. Price Oscillator (PRICEOSC) FAQ
8.1 What is the Percentage Price Oscillator (PRICEOSC)?
The Percentage Price Oscillator is the percentage-based form of the Price Oscillator. It divides the difference between two moving averages by a reference moving average and multiplies the result by 100, allowing direct comparisons of momentum across assets with different price levels.
8.2 How does Price Oscillator differ from MACD?
MACD expresses the difference between moving averages as an absolute value and is affected by the asset's price level. PPO expresses the difference as a percentage, allowing comparisons across assets regardless of price level and providing greater consistency in long-term analysis.
8.3 What trading strategies use the Price Oscillator?
The main approaches are zero-line crossover strategies (buying on a crossover above zero and selling on a crossover below zero), threshold strategies (using specific readings to identify overbought or oversold conditions), and divergence strategies (anticipating reversals when price and indicator movements diverge).
8.4 What is an oscillator in trading?
An oscillator is a type of technical indicator that fluctuates around a centerline or within a fixed range. Oscillators are used to measure market momentum, identify overbought and oversold conditions, and anticipate trend reversals.
8.5 How do oscillators differ from other technical indicators?
Technical indicators include trend indicators, volume indicators, and other types, and are commonly overlaid on price charts. Oscillators are a subset of technical indicators, generally displayed in a separate pane and fluctuating around a specific value.
8.6 How can I use the Price Oscillator on MEXC?
Add the Price Oscillator from the technical indicator list on MEXC's U.S. stock charts. After setting the fast and slow periods, use zero-line crossovers, thresholds, and divergences to help inform trading decisions.