

How to Use the Rate of Change Indicator (ROC) in Trading: A Complete Beginner's Guide
Key Takeaways:
- The Rate of Change indicator is a momentum oscillator that measures the speed of price changes.
- ROC uses a simple formula to calculate the percentage change between the current price and the price from a specified number of periods ago.
- ROC moves above and below the zero line and can be used to identify overbought and oversold conditions, divergence, and trend confirmation.
- ROC is a momentum indicator based on historical price data and should be used together with other technical analysis tools.
- Users can add ROC directly to the chart on MEXC to analyze market momentum.
1. What Is ROC?
The Rate of Change indicator, or ROC, measures how quickly the price of an asset changes. It is one of the most widely used indicators for measuring price momentum in technical analysis.
A larger absolute ROC value indicates a greater percentage price change over the selected period and, generally, stronger momentum. Users can add ROC to the chart on MEXC to assess the strength and direction of momentum in the crypto market.
2. How to Interpret ROC
ROC moves above and below the zero line. It can generally be interpreted as follows:
- Positive ROC: The current price is higher than it was N periods ago. A rising positive ROC generally indicates strengthening upward momentum.
- Negative ROC: The current price is lower than it was N periods ago. A falling negative ROC generally indicates strengthening downward momentum.
- ROC far from the zero line: An extreme reading indicates a large price change relative to the selected lookback period and may, in context, signal unusually strong momentum or potentially stretched market conditions.
Beginners should note that ROC should not be used alone to determine trading direction. Its movement must be interpreted together with its position relative to the zero line and the broader market trend.
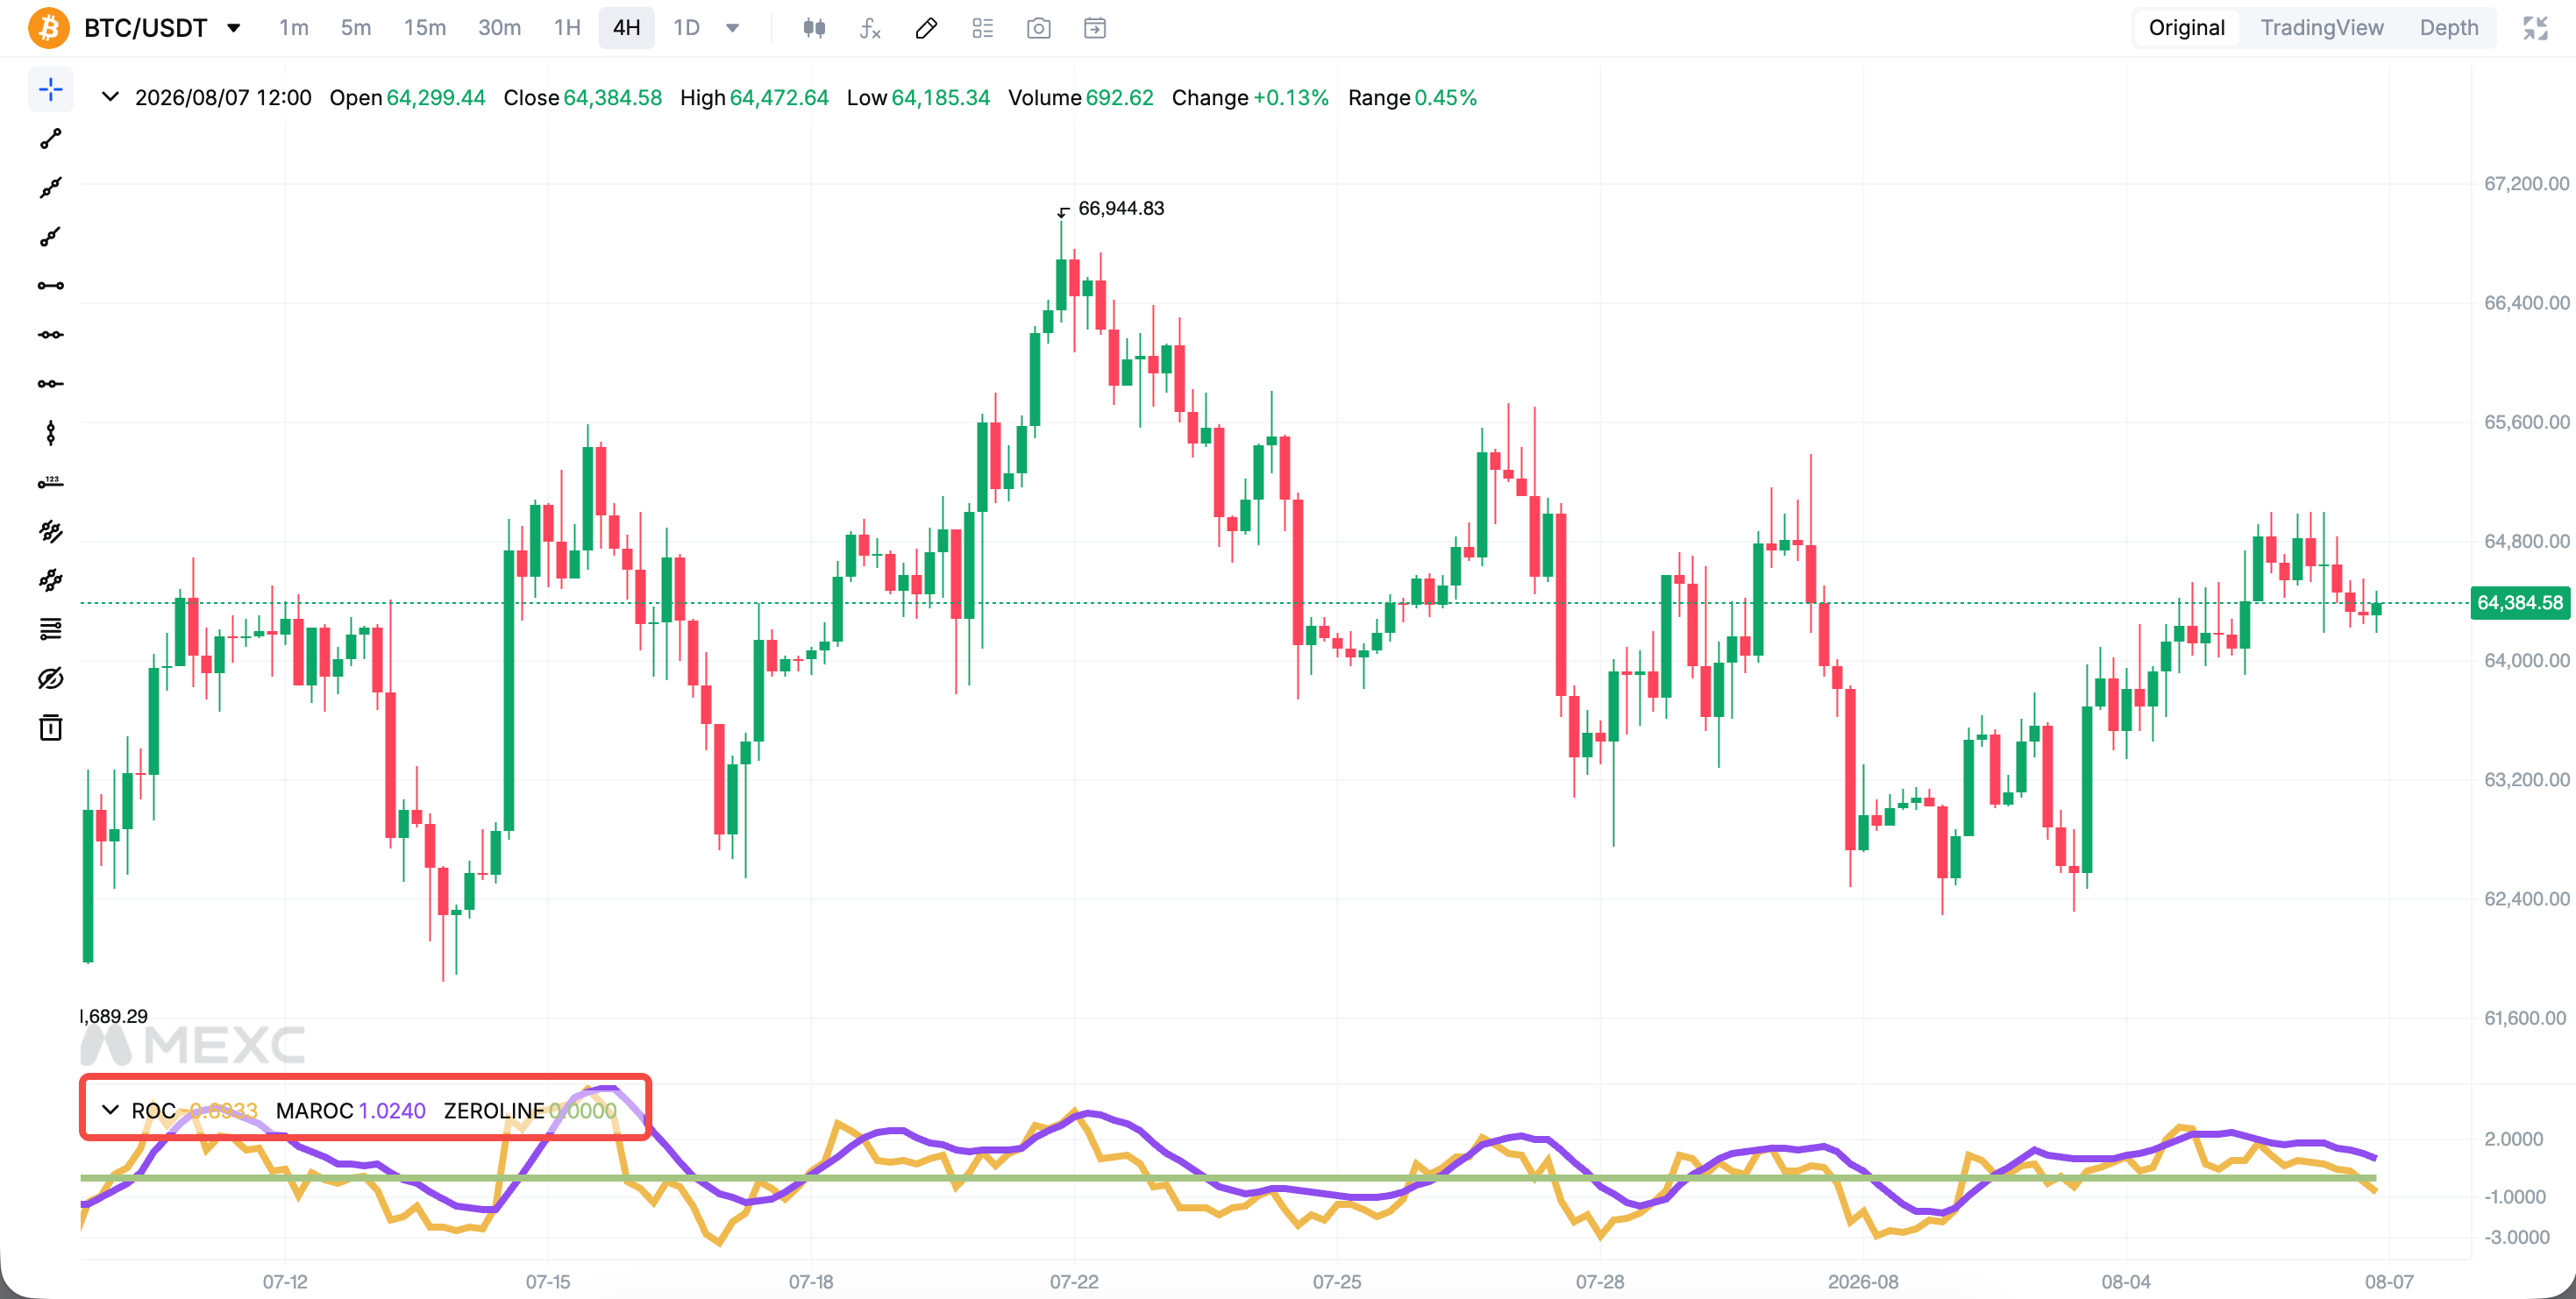
3. How to Use ROC in Trading
3.1 Zero-Line Crossovers
When ROC crosses above the zero line, it may be considered a potential buy signal. When ROC crosses below the zero line, it may be considered a potential sell signal.
3.2 Identifying Overbought and Oversold Conditions
When ROC reaches an extremely high level, the asset may be overbought and face a potential pullback. When ROC reaches an extremely low level, the asset may be oversold and have the potential to rebound.
ROC has no fixed thresholds for overbought and oversold conditions. Users can establish reference levels based on the historical ROC range and volatility of the specific asset and timeframe. Extreme ROC readings can persist during strong trends and do not necessarily indicate an imminent reversal.
3.3 Identifying Divergence
Bearish divergence: The price reaches a new high, but ROC fails to form a corresponding new high. This suggests that upward momentum is weakening and that the trend may reverse.
Bullish divergence: The price reaches a new low, but ROC does not form a corresponding new low. This indicates that downward momentum may be weakening.
Divergence is one of the most valuable early-warning signals provided by ROC.
3.4 Confirming Trends
ROC can provide additional confirmation of the direction and momentum of the current trend and give traders greater confidence in maintaining their positions.
4. Advantages and Limitations of ROC
Advantages:
- ROC is simple to calculate and easy to understand, making it suitable for traders of all experience levels.
- It can be applied across different digital assets, trading markets, and timeframes.
- It can help identify changes in momentum that may precede potential trend reversals.
Limitations:
- ROC may generate false signals in sideways or range-bound markets.
- Because ROC is based on historical price data, its signals may not reliably anticipate future price movements or turning points.
Traders should combine ROC with trend-following tools such as moving averages and Bollinger Bands to to provide additional context and confirmation.
5. How to Use ROC on MEXC
Open the chart for any trading pair and add the Rate of Change indicator from the indicators menu. The ROC line will appear below the main chart and move above and below the zero line.
Users can customize the period and combine ROC with other indicators to develop their own trading strategies. ROC can then be used alongside other charting tools on MEXC to analyze changes in market momentum.
6. ROC FAQ
6.1 How do you use ROC in trading?
ROC can be used in four main ways: using zero-line crossovers as momentum signals, identifying overbought and oversold conditions through extreme readings, identifying divergence between price and ROC as a sign of weakening momentum, and confirming trends by comparing ROC with price movements.
6.2 Is the ROC useful?
ROC is a simple and effective tool for measuring momentum. However, it may generate false signals in range-bound markets and should be used together with other technical indicators rather than as a standalone basis for trading decisions.
6.3 What is the difference between ROC and RSI?
The Relative Strength Index compares the magnitude of recent gains and losses and commonly uses 30 and 70 as oversold and overbought reference levels. ROC compares the closing prices at two points in time and has no fixed upper or lower boundaries.
6.4 Can ROC determine price direction?
Not on its own. ROC primarily reflects the direction and strength of momentum and should be used together with trend indicators to assess price direction.
With its simple calculation and broad range of applications, ROC is a widely used tool for measuring market momentum. Beginners should understand its key uses, including zero-line crossovers, extreme readings, divergence, and trend confirmation. They should also practice using ROC with other technical indicators on MEXC to develop a more comprehensive view of market conditions.
Recommended Reading:
Risk Disclaimer: Technical indicators are calculated using historical data and are provided for reference only. They cannot guarantee future market performance. Digital asset markets are highly volatile, and trading involves risk. Make decisions carefully based on your own risk tolerance and avoid following market trends blindly.