

How to Use Drawing Tools (Original K-Line)
Website
App
Popular Articles
View More
Can XRP Reach $1,000? The Math Says No, Here's Why
Every crypto rally brings the same question back: can XRP reach $1,000? It is one of the most-searched price targets in all of crypto, and the short answer is no — not at anything close to XRP's

Will XRP Replace SWIFT? Inside Ripple's 14% Bet Against the Banking Giant
Every time XRP makes headlines, the same debate resurfaces — can a cryptocurrency actually challenge the backbone of global banking? SWIFT has moved trillions of dollars across borders for decades,

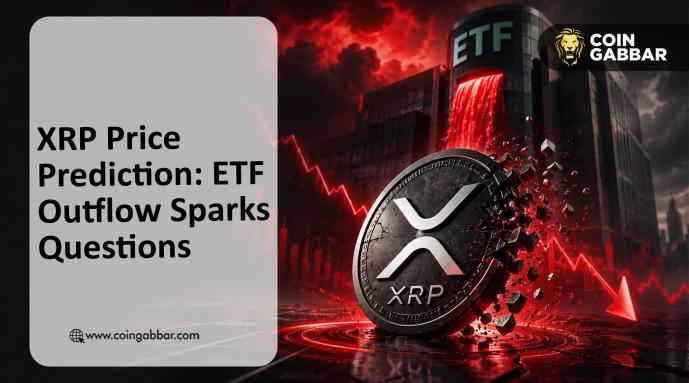
Is XRP Dead? The Case Is Closed, the ETFs Are Live — Now What?
"Is XRP dead?" is a question that comes back every time the price drops hard — and it has dropped hard more than once. Search interest in the phrase has climbed for two straight years, spiking on

Hot Crypto Updates
View More
CLARITY Act Odds Fade Toward 50/50: What the Stalled Crypto Bill Means for XRP
The single biggest catalyst hanging over XRP, the CLARITY Act, is looking less certain by the week. Galaxy Research just cut its odds of the US crypto market-structure bill passing in 2026 to 50%,

XRP Q2 2026 Price Prediction: Has the Bottom Arrived or Is the Sell-Off Not Over?
XRP is trading near $1.24 in Q2 2026 as spot ETF inflows hit a yearly high and the CLARITY Act clears a Senate committee. Here's what analysts really expect — and why the divergence matters. Overview

XRPL 3.2.0 Is Live: The End of rippled, and What XRP Holders Actually Need to Do
XRP Ledger's v3.2.0 mainnet upgrade activated on June 15, 2026, renaming the core server software from rippled to xrpld and cutting node memory usage by up to 40%. Here's what it means for XRP

Trending News
View More
XRP Price Holds Triangle Breakout as Analysts Watch $1.50 Resistance
Key Insights: XRP price traded near $1.09 as analysts assessed whether the latest pullback marked a breakout retest. Short-term charts showed support holding, though

XRP Ledger Bags US Supply Chain Deal as RWA Tokenization Hits New Milestone
Key Insights: XRP Ledger has added another business use case after Made In USA Inc. picked the blockchain for its product verification system. The news comes as
Related Articles
View More
How to Use TradingView on MEXC
TradingView is a powerful trading analysis tool that caters to users of all experience levels. MEXC has integrated TradingView's charting tools, allowing you to use them directly on the MEXC platform.

Analysis of Common Technical Indicators in the Cryptocurrency Market
In crypto trading, technical indicator analysis refers to a quantitative method that uses mathematical and statistical formulas to assess market trends. By processing price and volume data through spe

What Is the Stochastic Indicator (KDJ)?
The Stochastic Indicator (KDJ) is a technical analysis tool that analyzes price trends to assess market strength and identify overbought and oversold conditions, helping traders make buy and sell deci


